Скачать
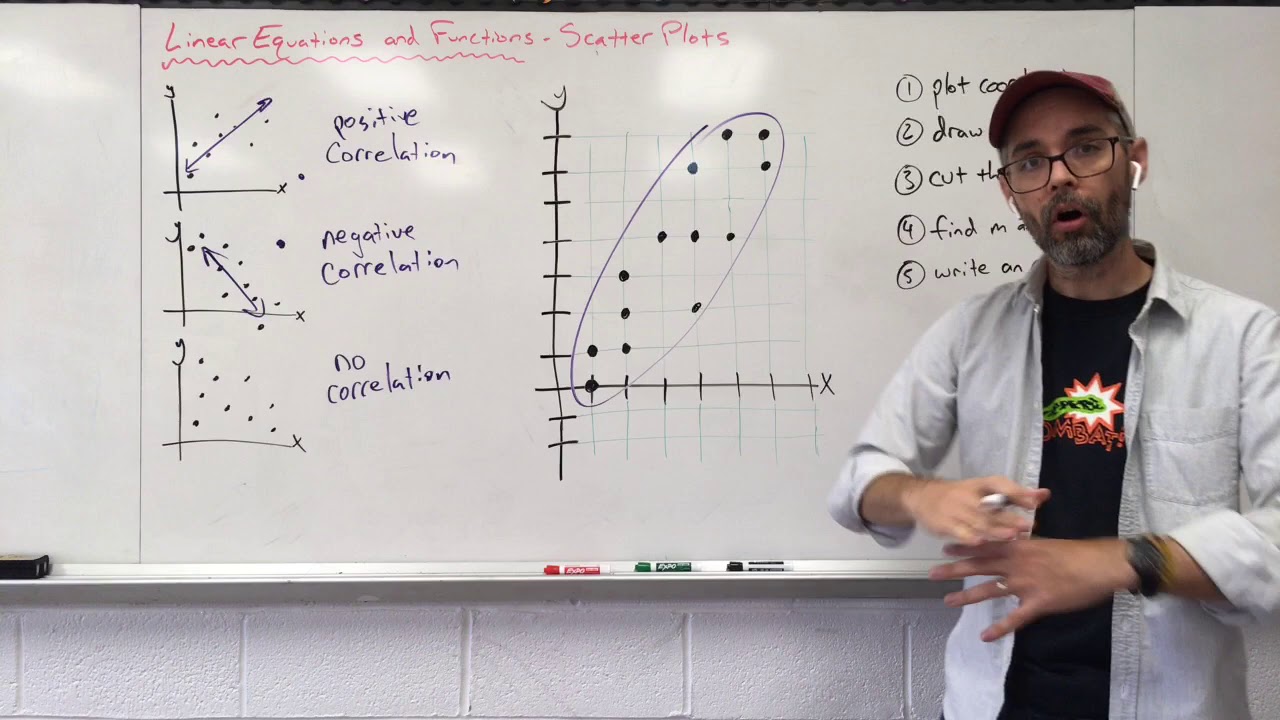
DATA - Scatter plot (line of best fit & correlation)
Автор: The Maths Shack
Загружено: 2021-03-03
Просмотров: 673
Описание: In this video I demonstrate how to draw a scatter plot graph with the line of best fit as well as identifying the different types of correlations. I demonstrate how to draw a scatter plot as well as how to interpret a scatter plot. I hope you enjoy this video and that it helps you.
Не удается загрузить Youtube-плеер. Проверьте блокировку Youtube в вашей сети.
Повторяем попытку...
Повторяем попытку...
Доступные форматы для скачивания:
Скачать видео
-
Информация по загрузке: