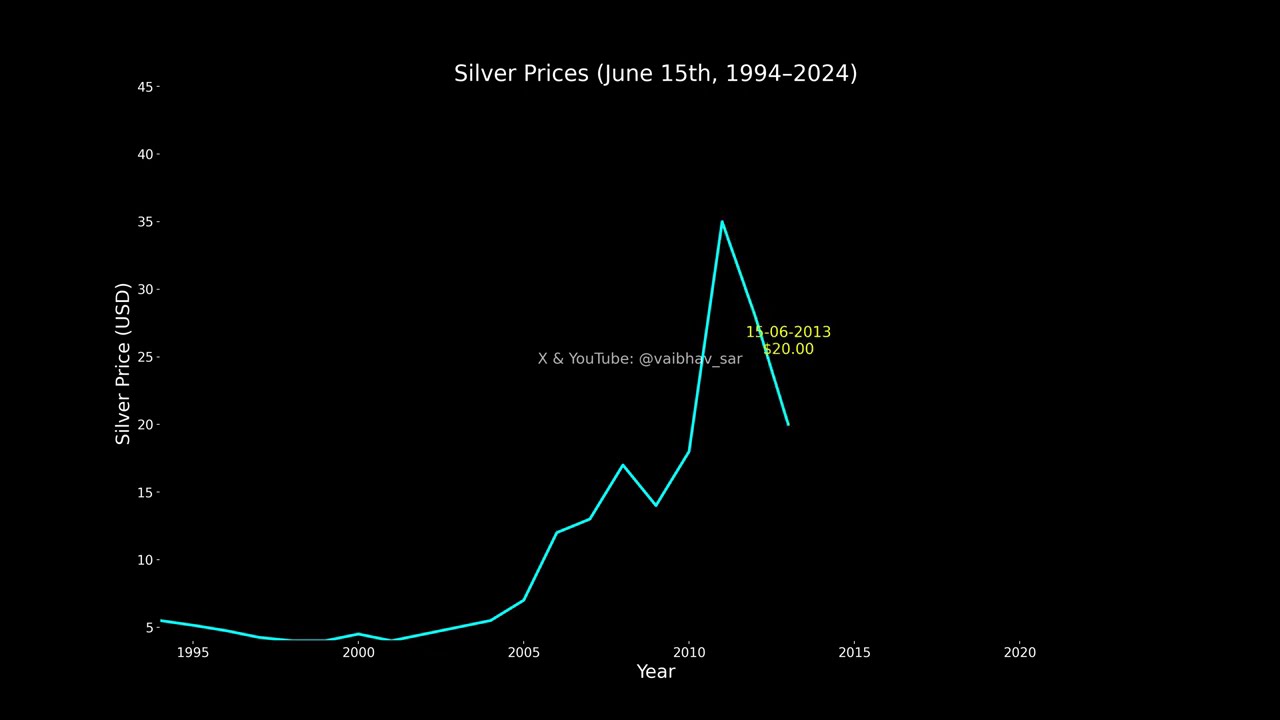
Silver Price Trend: 1994–2024 | 30-Year Historical Data Visualization
Автор: Vaibhav Sarupria
Загружено: 2024-10-29
Просмотров: 386
Описание:
Dive into 30 years of financial market history with this animated line chart showing the price trends of Silver from 1994 to 2024. Each price represents the value on June 15th of each year, providing an in-depth look at market fluctuations over three decades.
🔹 Silver Price Trend (1994–2024): Watch the historical shifts in crude oil prices, reflecting economic changes, geopolitical events, and demand-supply dynamics.
📈 Key Highlights:
Animation pauses at each price point to highlight significant changes.
Visual representation of annual prices, making complex data easy to understand.
Perfect for investors, traders, and financial enthusiasts seeking insights into long-term market trends.
🔔 Subscribe for more historical data visualizations, financial analyses, and market trends.
👉 Like, Share, and Comment if you found this video helpful!
Open free trading and demat account: https://signup.zerodha.com/?c=ZMPPPC
#Silver #MarketAnalysis #HistoricalData #FinancialTrends #Investment #DataVisualization #30YearAnalysis
Повторяем попытку...
Доступные форматы для скачивания:
Скачать видео
-
Информация по загрузке: