Скачать
Histogram in LabPlot (KDE edu)
Автор: Anu Mittal
Загружено: 2016-08-19
Просмотров: 3388
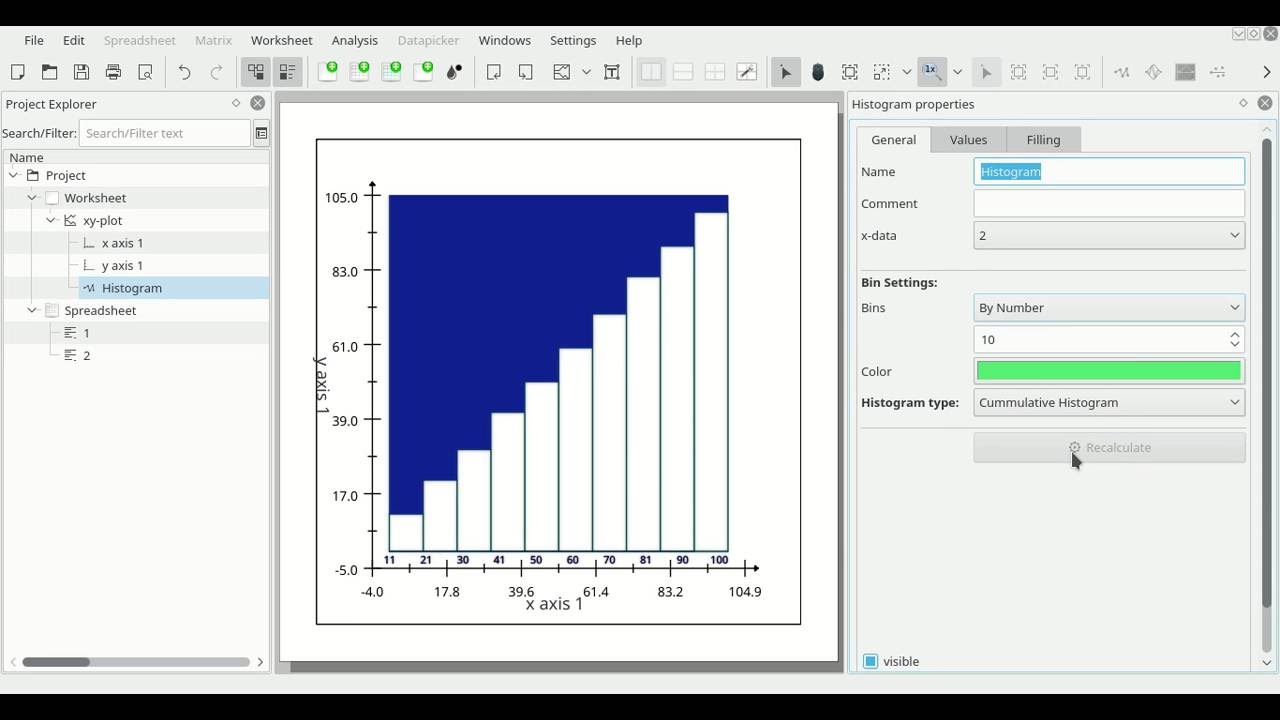
Описание: A histogram is a plot that allows you to observe and understand the pattern of the underlying frequency distribution (shape) of a set of continuous data. Introducing histogram to LabPlot allows the user to plot different type of histogram for various scientific data.
Не удается загрузить Youtube-плеер. Проверьте блокировку Youtube в вашей сети.
Повторяем попытку...
Повторяем попытку...
Доступные форматы для скачивания:
Скачать видео
-
Информация по загрузке: