$TSLA Tesla Stock Analysis: Bullish Inverse Head & Shoulders Pattern – Breakout Targets Revealed!🚀
Автор: Donald Dean
Загружено: 2026-01-06
Просмотров: 10
Описание:
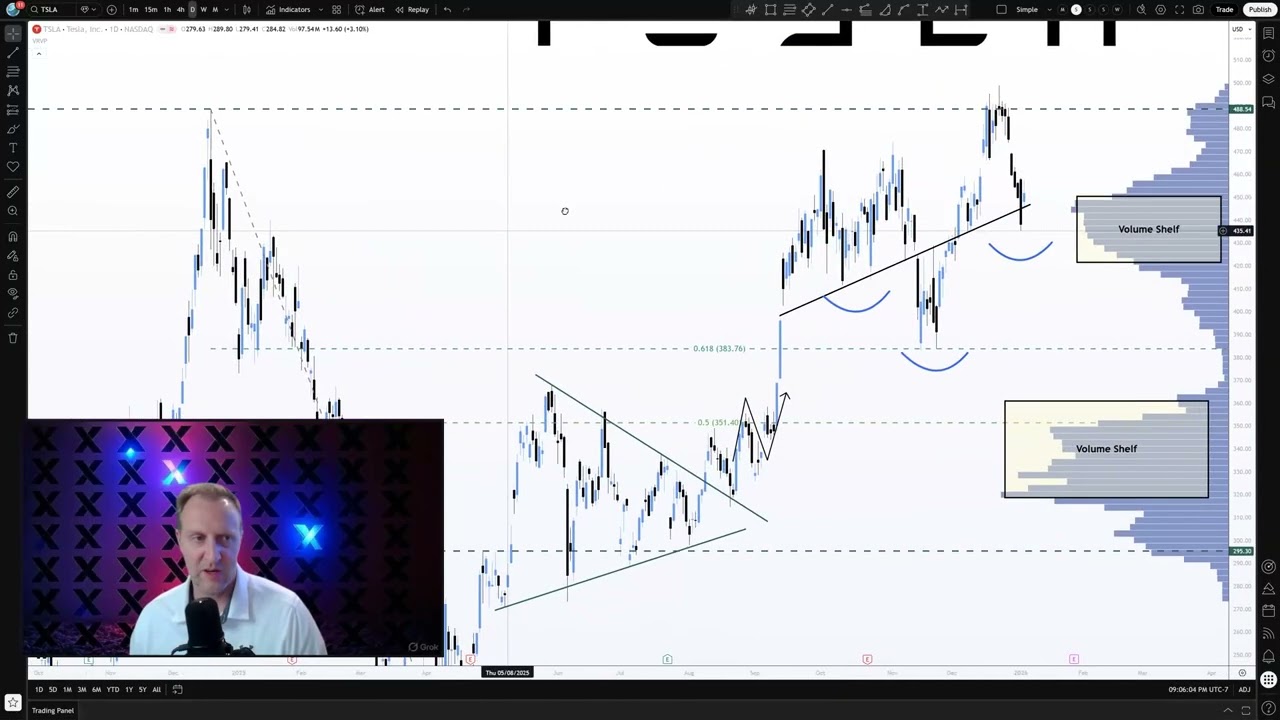
In this in-depth Tesla ($TSLA) technical analysis, I break down the recent pullback after disappointing Q4 delivery numbers, and reveal a promising inverse head and shoulders pattern forming on the chart. Despite the drop from December highs around $490, key support levels are holding strong since April.
We dive into the current resistance near $485 – will TSLA break above it for a massive bullish reversal? If it does, I'll show you the measured move targets: first $563, then $602, and potentially $658.
Is this the setup for Tesla's next big rally in 2026? Watch now for full chart breakdown, price history, and my outlook!
Повторяем попытку...
Доступные форматы для скачивания:
Скачать видео
-
Информация по загрузке: