Data & Statistics - Mean, Median, Mode, Range, & Standard Deviation - SAT Math Part 44
Автор: The Organic Chemistry Tutor
Загружено: 2019-05-13
Просмотров: 74602
Описание:
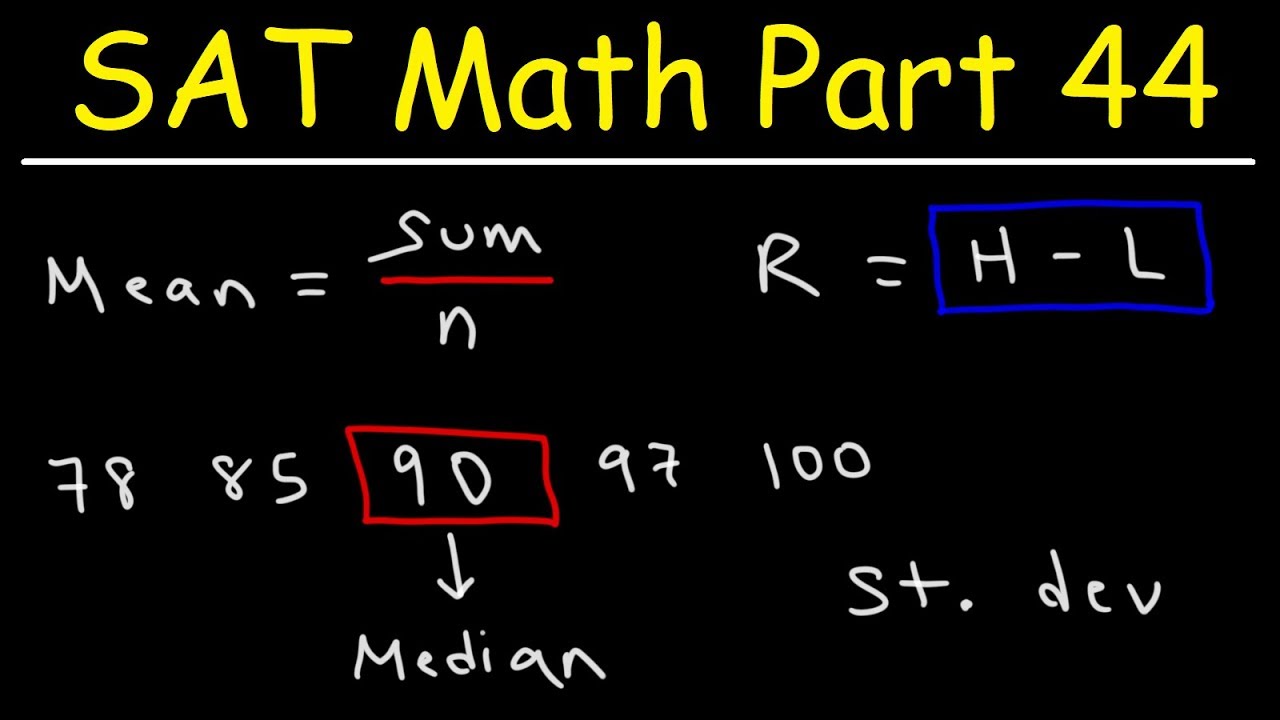
This SAT Math video provides a basic introduction into data and statistics. It explains how to calculate the mean, median, mode, and range of a data set in a frequency table. It also explains how to determine which data set has a higher standard deviation value.
SAT Math Video: • SAT Math Test Prep Online Crash Course Alg...
SAT Chemistry Part 1: • Видео
___________________________________
Introduction to Statistics:
• Introduction to Statistics
Descriptive Vs Inferential Statistics:
• Descriptive Statistics vs Inferential Stat...
Qualitative and Quantitative Data:
• Qualitative and Quantitative
Statistic Vs Parameter:
• Statistic vs Parameter & Population vs Sample
Scales of Measurement:
• Scales of Measurement - Nominal, Ordinal, ...
__________________________________
Mean, Median, Mode, & Range:
• Mean, Median, Mode, and Range - How To Fin...
Weighted Mean & Averages:
• How To Find The Weighted Mean and Weighted...
Find Missing Value Given The Mean:
• How To Find The Missing Value Given The Me...
Excel - Mean, Median, Mode, & Range:
• Calculating The Standard Deviation, Mean, ...
Arithmetic, Geometric, & Harmonic Mean:
• Arithmetic Mean, Geometric Mean, Weighted ...
___________________________________
Simple Frequency Tables:
• How To Make a Simple Frequency Table
Relative Frequency Distribution Table:
• How To Make a Relative Frequency Distribut...
Cumulative Relative Frequency Table:
• How To Make a Cumulative Relative Frequenc...
Dot Plots and Frequency Tables:
• Dot Plots and Frequency Tables
Stem and Leaf Plots:
• Stem and Leaf Plots
____________________________________
Final Exams and Video Playlists:
https://www.video-tutor.net/
Повторяем попытку...
Доступные форматы для скачивания:
Скачать видео
-
Информация по загрузке: