$1,000 Invested in Google Stock (2004-2026) | Animated Chart
Автор: Your Investor Lab
Загружено: 2026-05-28
Просмотров: 305
Описание:
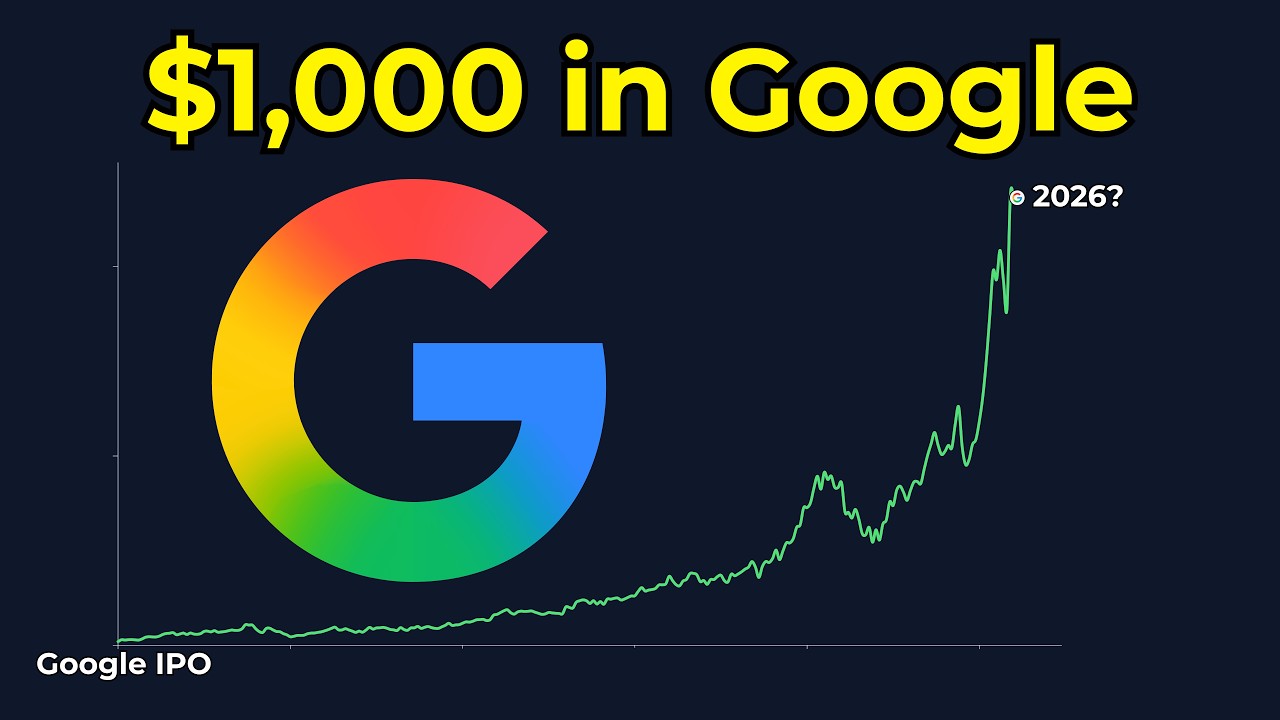
Watch what happens to a $1,000 investment in Google (Alphabet) from its IPO in 2004 to 2026 in this animated chart. See how major events like the acquisition of YouTube, the Android revolution, and the push into generative AI with Gemini impacted the ultimate tech portfolio.
📊 Data Source: Investing.com
📅 Period: 2004 - 2026
💰 Initial Investment: $1,000
📈 Asset: Alphabet Inc. (GOOG / GOOGL)
🔴 Dividends not Included
In this data visualization, we track the exact value of a $1,000 Google investment through its biggest historical milestones. From its highly anticipated 2004 IPO to Larry Page and Sergey Brin's legendary acquisitions, massive stock splits, the restructuring into Alphabet, and making history as one of the few companies to reach a $1 and $2 Trillion market cap.
Whether you are into stock market investing, tech history, or just love animated chart races, this video shows the incredible ROI (Return on Investment) and massive growth of Alphabet over the last two decades. Exactly how much is that $1,000 worth by 2026? Watch until the end to find out!
👇 The Eras of Google (Chapters):
0:00 The 2004 IPO & Search Engine Dominance
0:14 Buying YouTube & The Android Revolution
0:36 Surviving the Crash & The Chrome Era
1:57 The Alphabet Restructuring & Sundar Pichai
2:53 Pandemic Tech Boom & $2 Trillion Milestone
3:27 The AI Wars: Gemini & The Future of Search
📈 Subscribe for more animated charts, stock market trends, market history, and financial data visualization!
⚠️ Disclaimer: This video is for educational and entertainment purposes only. It is not financial advice. Always do your own research before investing in the stock market, crypto, or any other assets. Past performance is not indicative of future results.
#Google #Alphabet #GOOG #StockMarket #DataVisualization #Investing #TechHistory #Finance #AnimatedCharts #StockMarketHistory
Повторяем попытку...
Доступные форматы для скачивания:
Скачать видео
-
Информация по загрузке: