NCEA L3 Chem - Sketching a Weak Acid vs Strong Base Titration Curve
Автор: Science Scribe
Загружено: 2014-11-08
Просмотров: 3446
Описание:
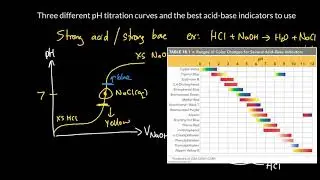
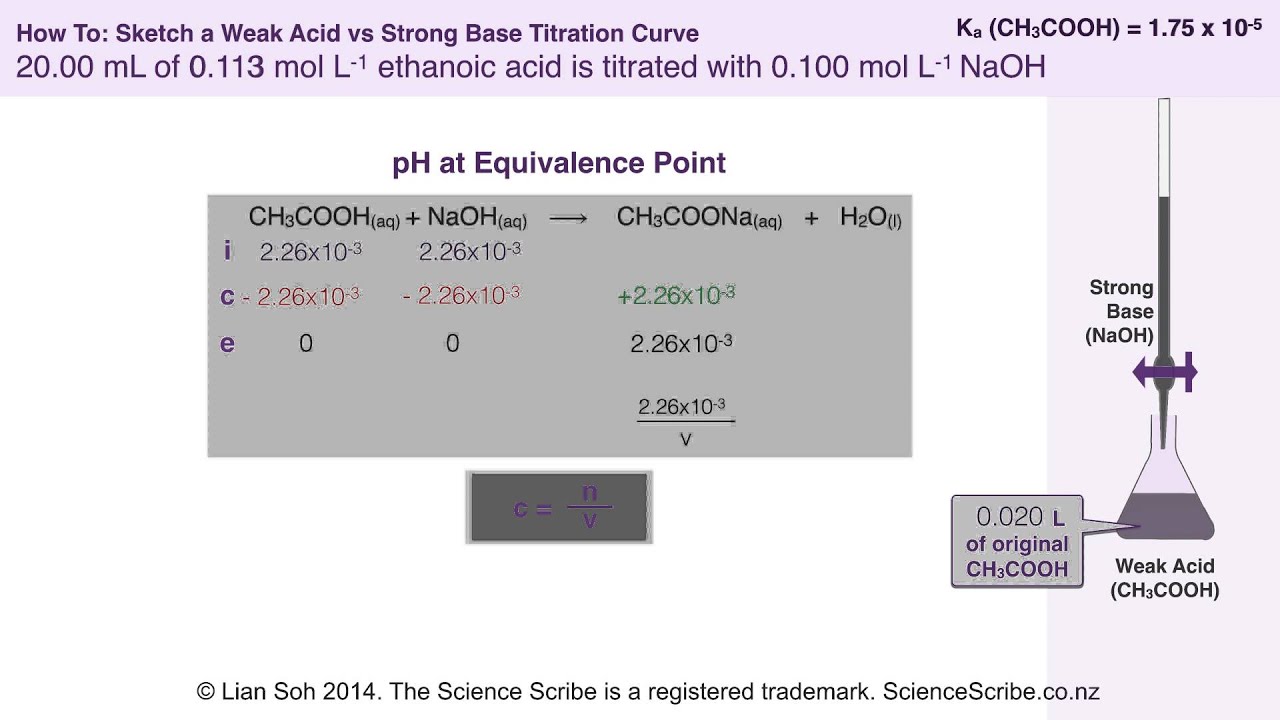
This video shows students how to sketch a weak acid vs strong base titration curve. For the best viewing results, watch this on a PC as there are clickable video annotations to add depth by referring to prior learning.
Note that if you want to be more thorough by including the pH values between the starting point and equivalence point then you can use the video on Buffer pH Calculations (via I.C.E tables) to help you: • NCEA L3 Chem - How to find the pH of a buf...
TEACHER NOTE - emphasise the assumptions made during weak acid/base calculations and don’t forget to also draw students’ attention to the selection of an appropriate indicator. You might also want to refer learners to the video "Speciation Graphs II" to show how the species in solution change during a titration: • NCEA L3 Chem: Speciation Graphs Part 2
Повторяем попытку...
Доступные форматы для скачивания:
Скачать видео
-
Информация по загрузке: