Grafana | Logs Setup | Monitor SSH Logins & User Session
Автор: Knight5oul Terminal
Загружено: 2026-05-22
Просмотров: 119
Описание:
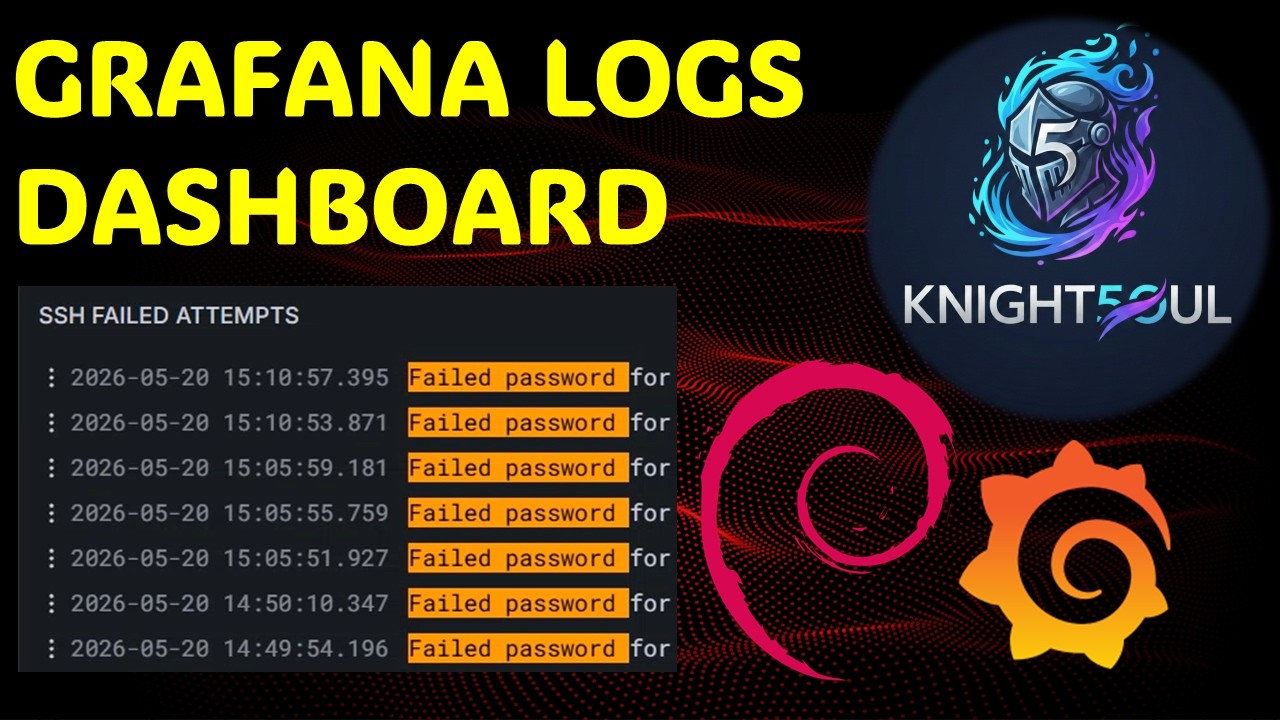
In this video, we conclude our series by integrating live log visualization into our Grafana dashboard using Promtail and Loki. We walk through how to configure our log collector to safely feed system logs directly into Grafana, creating a centralized backend for authentication data. From there, we build out two practical security panels: one tracking active user sessions and another catching failed SSH login attempts. Finally, we run a live test from a Windows command prompt, letting you watch the dashboard instantly capture and visualize the authentication events in real time. This wraps up our setup, giving you a complete, production-ready monitoring platform.
0:15-------Loki Connection
0:58-------Promtail Logs Config
2:13-------Editing the dashboard
2:35-------First Visual (SSH Failed Login)
4:25-------Testing the visual
5:15-------Second Visual (Live Sessions)
6:25-------Testing the 2nd visual
Disclaimer:
This video is for educational purposes only. All software, logos, and trademarks shown in this video belong to their respective owners; their appearance does not imply endorsement or affiliation. The use of these materials is intended under Fair Use for educational and instructional purposes.
All demonstrations and experiments were conducted within private, controlled environments. The author assumes no responsibility for any misuse of the information provided or for any actions taken by viewers outside of these instructional parameters.
Повторяем попытку...
Доступные форматы для скачивания:
Скачать видео
-
Информация по загрузке: