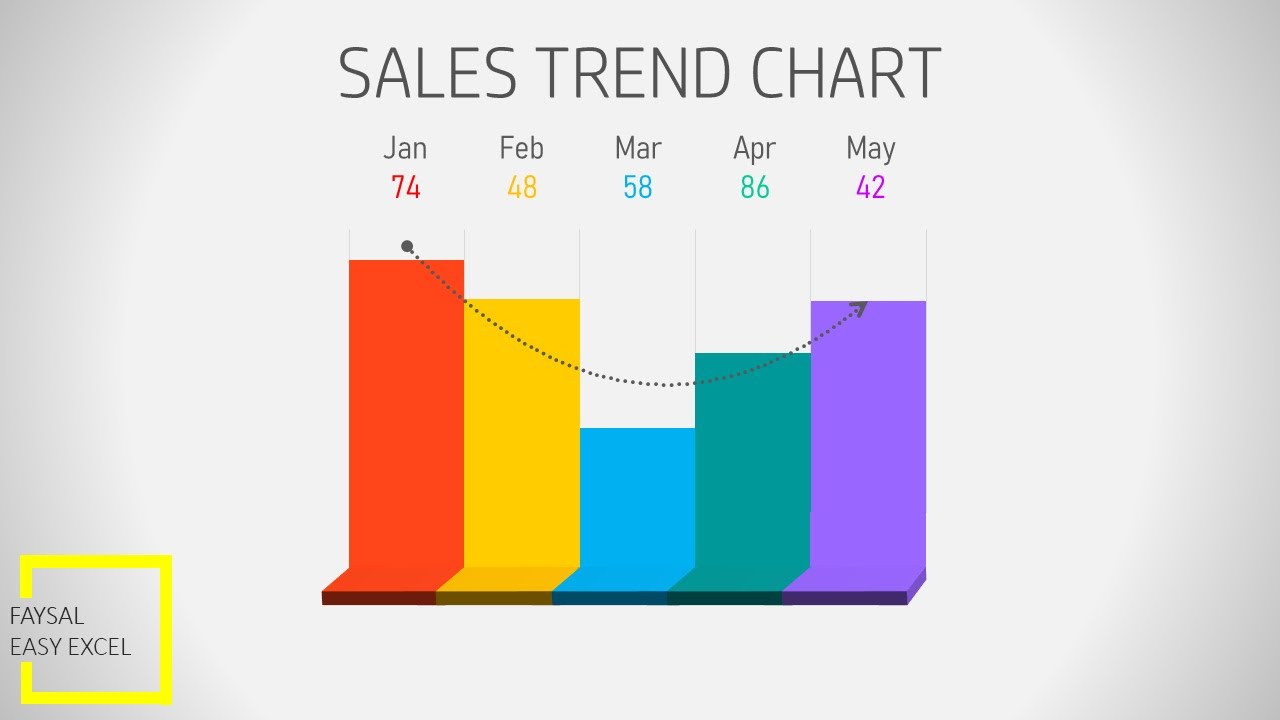
Infographic 3D Column Chart in Excel 2016
Автор: Faysal Easy Excel
Загружено: 2020-06-11
Просмотров: 1233
Описание:
FREE Download this Microsoft Excel Workbook from below link. Please SUBSCRIBE, Like, Comment and Share this video to your friends and family.
👆 Please Click this link to SUBSCRIBE: https://www.youtube.com/faysaleasyexc...
💾 Free Download Link:
https://docs.google.com/spreadsheets/...
👩🏫 About this video:
This Microsoft Excel tutorial will help to learn excel charts with step by step direction including excel tips and tricks. Excel for beginners to advanced Excel users can easily learn How to Create Infographic 3D Stacked Column Chart in Excel 2016. It is usable in your Business Presentation. Follow our very easy steps from this video about How to Create Infographic 3D Stacked Column Chart in Excel 2016 to increase your Microsoft Excel skill. We wish your success to make this beautiful Infographic 3D Stacked Column Chart in Excel 2016. Hope you will like this chart.
✅ Join us:
YouTube: https://www.youtube.com/faysaleasyexc...
Blog: https://afaysal.blogspot.com
🎥 Watch our other videos:
1. Emojis in Excel: • How to insert Emojis in Excel formula with...
2. Excel Match function: • Excel Match function and how to use Match ...
3. Excel MID function: • Excel MID Function | Extract the Time from...
4. Add Zero before Numbers in Excel: • How to add Zero before numbers in Excel 2016
5. Hide and Unhide Columns: • How to hide and unhide columns in Excel 2016
6. Make a Drop-Down list: • How to make a drop down menu in Excel 2016
7. My Fiverr Excel Test: • My Fiverr Microsoft Excel 2016 Skill Test ...
8. Daily Sales Trend Chart: • Daily Sales Trend Report in Excel 2016
9. Present vs Previous Sales: • Present vs Previous Month Daily Sales Tren...
10. Mobile Phone Sales Dashboard: • Mobile Phone Sales Dashboard in Excel 2016
11. Smart Watch Sales Dashboard: • Smart Watch Sales Dashboard in Excel 2016 ...
12. Gauge Chart: • Dashboard Gadget Gauge Chart in Excel 2016...
13. Speedometer Chart: • Dashboard Gadget Speedometer Chart in Exce...
14. Metal Bar Chart: • Infographic Metal Bar Chart in Excel 2016
15. 2D Pencil Chart: • New Infographic 2D Pencil Chart in Excel 2016
16. Test Tube Chart: • Infographic 3D Test Tube Chart in Excel 2016
17. Pillar Chart: • Learn Infographic 3D Pillar Chart in Excel...
18. Pencil Bar Chart: • Infographic Pencil Bar Chart in Excel 2016
19. Column Chart with background: • 2D Column Chart with Background Image in E...
20. Cylinder Chart: • 3D Cylinder Progress Column Chart in Excel...
#excelcharts #piechart #stackedcolumnchart #2dchart #exceltips #exceltricks #msexcel #faysaleasyexcel #excelformula #excel2016 #learnexcel #excelforbeginners #microsoftexcel #exceltraining
Повторяем попытку...
Доступные форматы для скачивания:
Скачать видео
-
Информация по загрузке: