Скачать
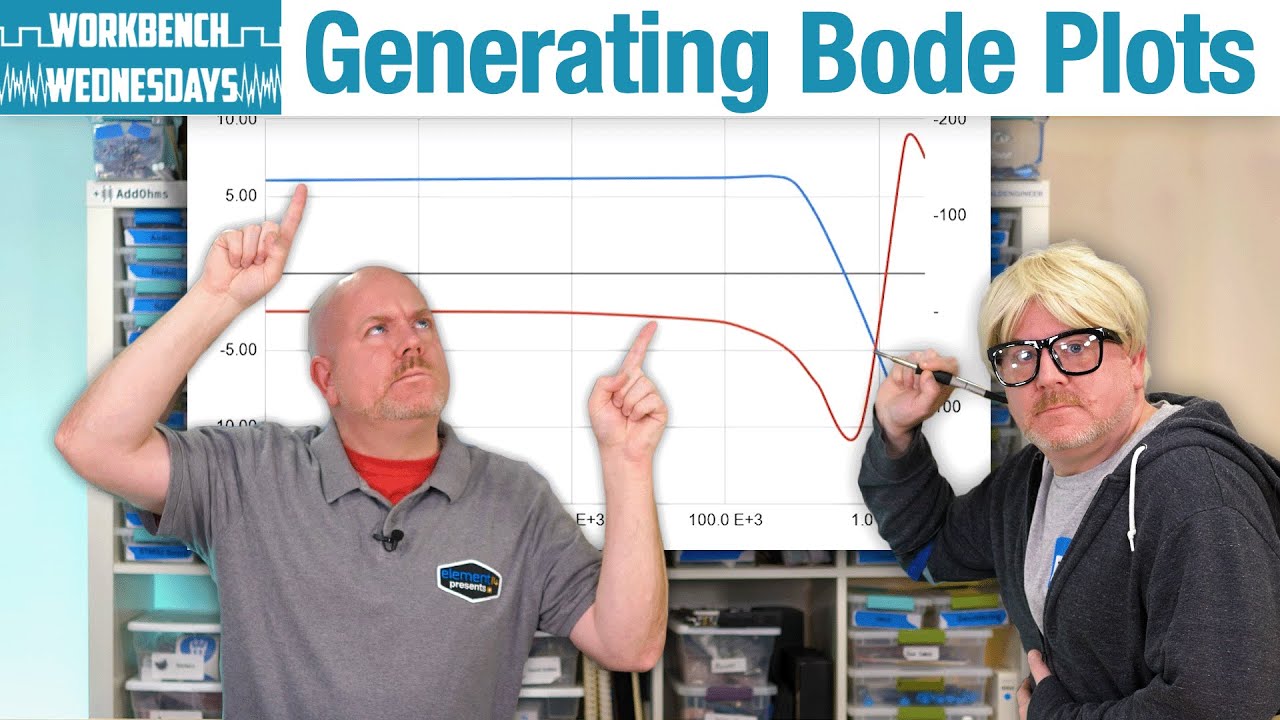
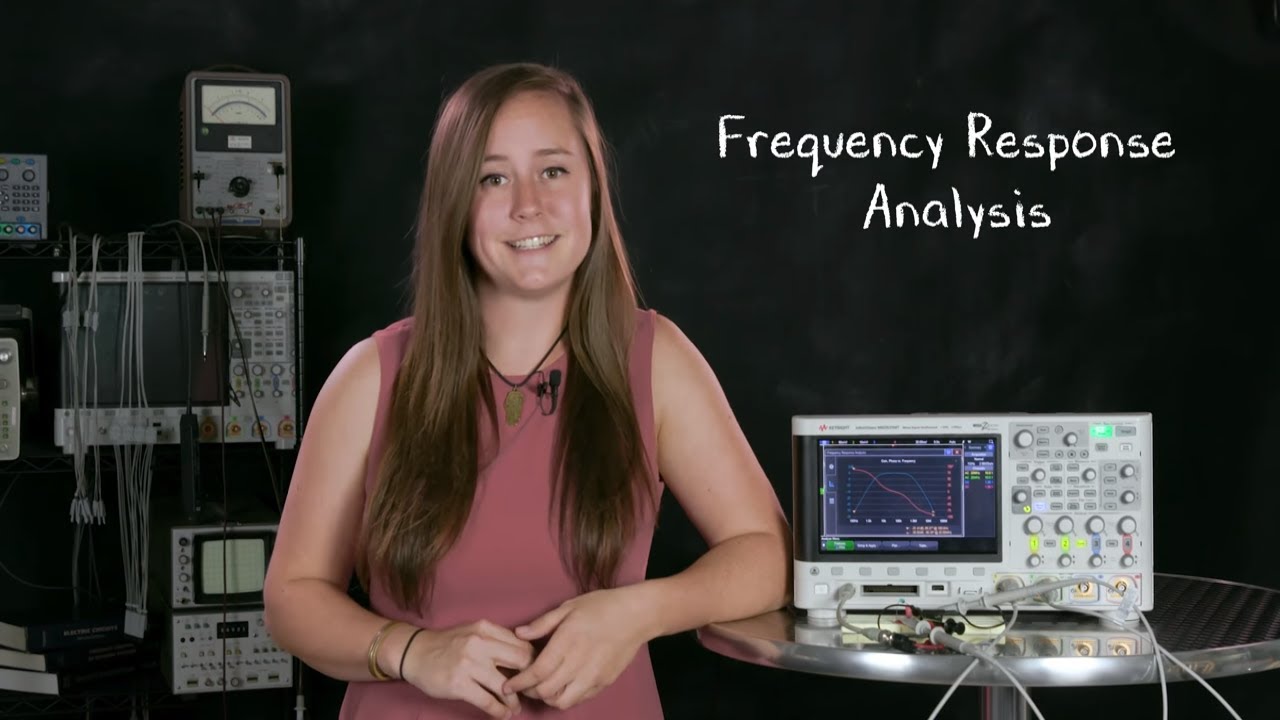
Frequency Response Curves (Bode Plot) using an Oscilloscope and Function Generator
Автор: Siglent Technologies
Загружено: 2018-09-17
Просмотров: 17357
Описание:
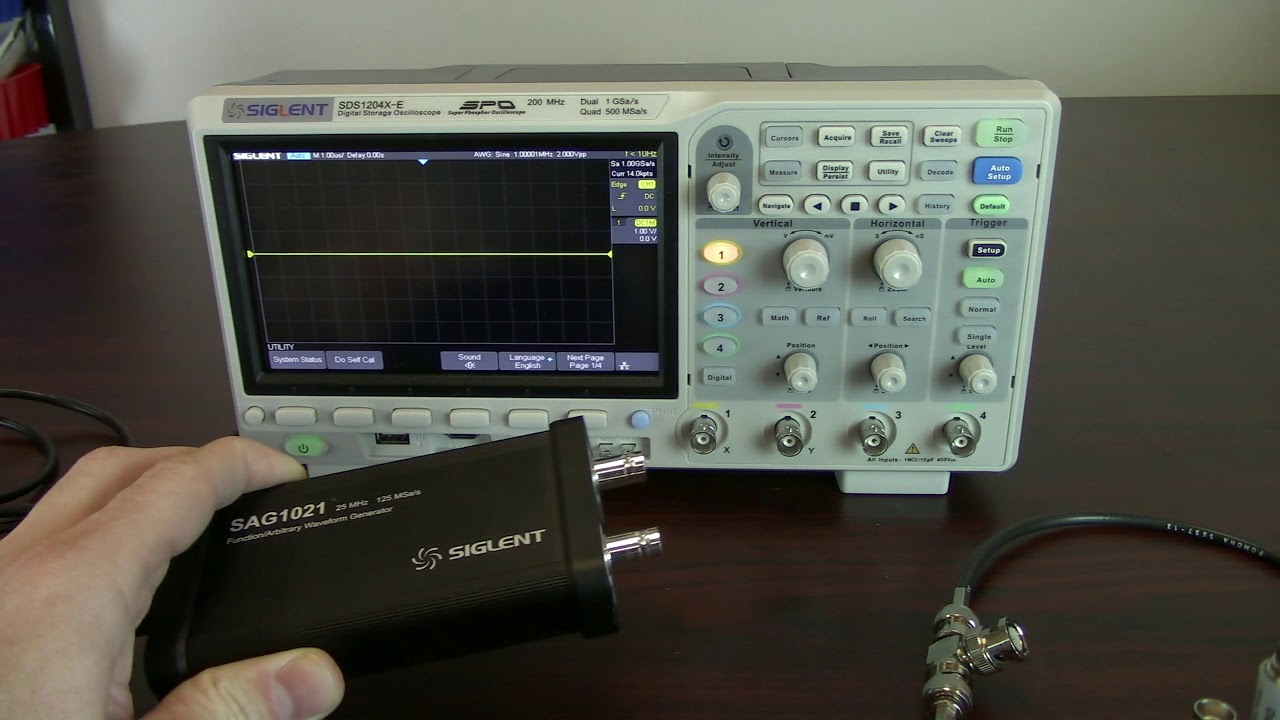
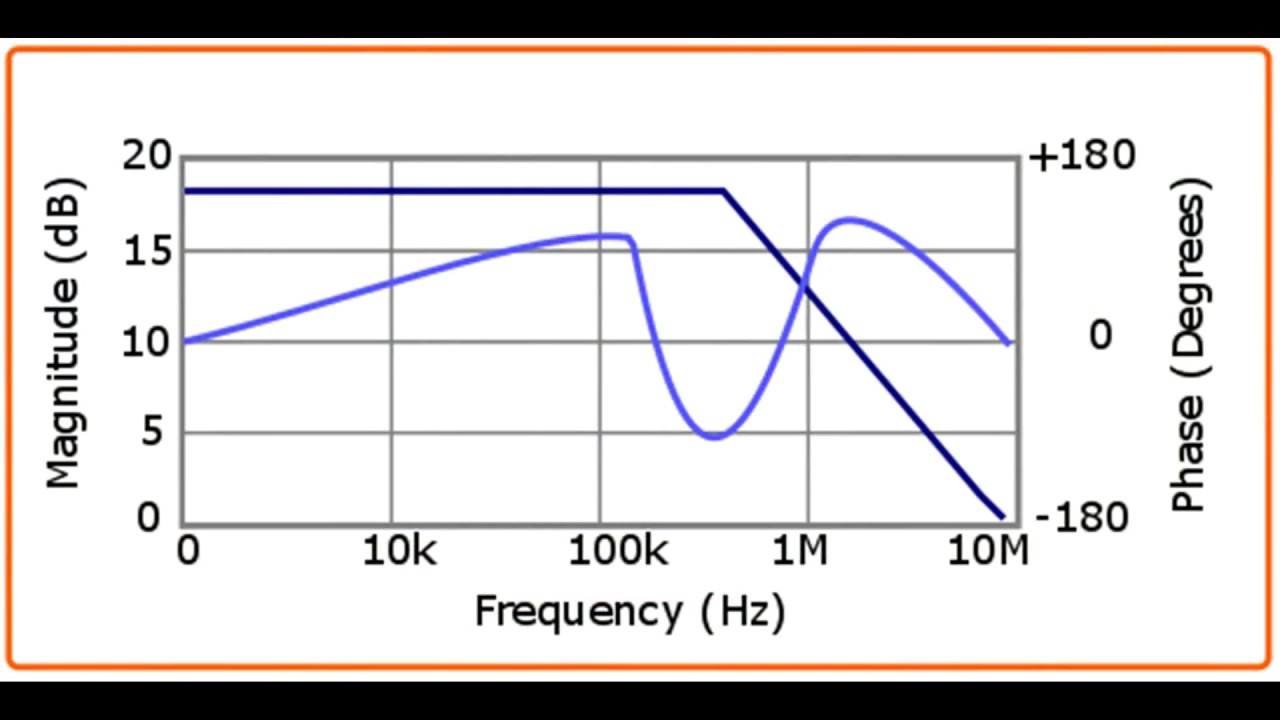
In this video, we show how to use the automated Bode Plot feature of the SIGLENT SDS1004X-E series of four channel oscilloscopes to create a frequency response curve.
This video applies to the SIGLENT SDS1104X-E and SDS1204X-E oscilloscopes as well as the SDG X series (SDG1X, 2X, and 6X) of arbitrary waveform generators.
Не удается загрузить Youtube-плеер. Проверьте блокировку Youtube в вашей сети.
Повторяем попытку...
Повторяем попытку...
Доступные форматы для скачивания:
Скачать видео
-
Информация по загрузке: