How To Use TRACE (S&P 500 Heatmap App) by SpotGamma
Автор: SpotGamma
Загружено: 2024-09-23
Просмотров: 15425
Описание:
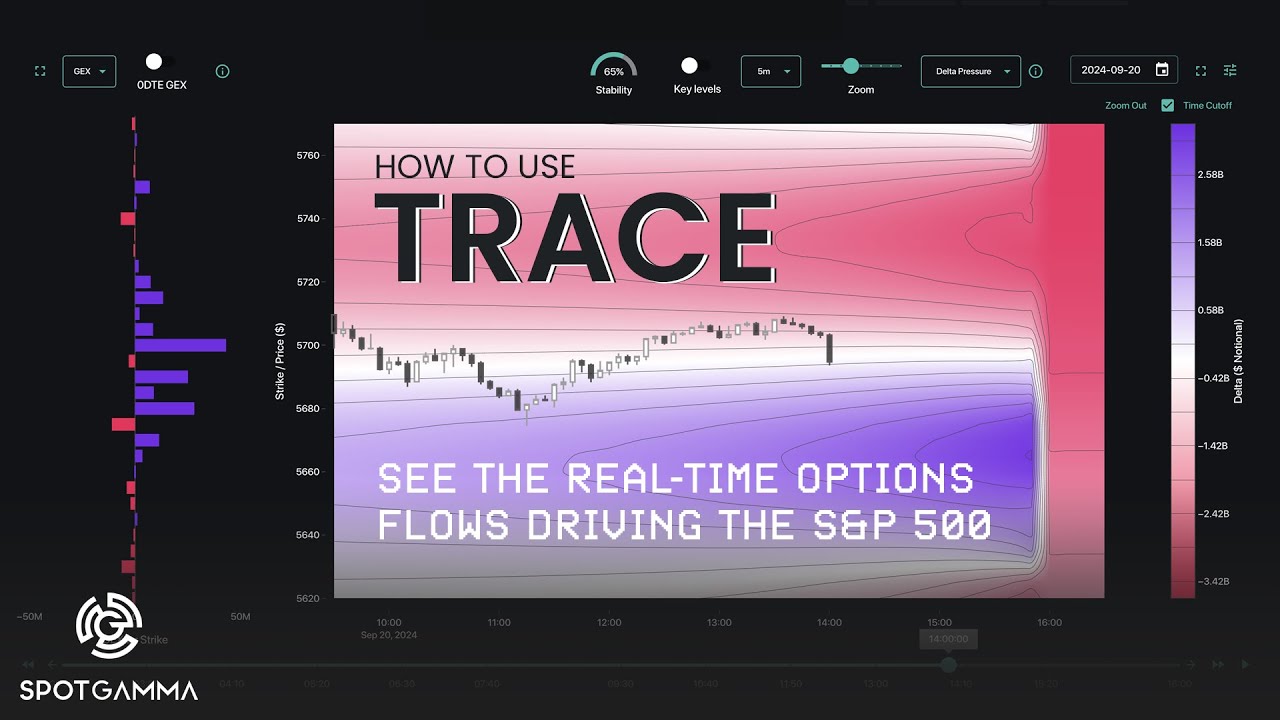
Unlock the power of TRACE—the best way to visualize how real-time options flows are influencing the S&P 500. Developed by SpotGamma, TRACE ingests all SPX options trades and applies proprietary algorithms to create easy-to-interpret charts and heatmaps. In this quick-start tutorial, we'll break down how to apply TRACE to your trading strategies.
Key Features:
1. Strike Plot:
• GEX (Gamma Exposure), OI (Open Interest), and Net OI:
• Blue GEX bars indicate where dealer positioning can result in buying pressure.
• Red GEX bars show where dealer hedging can lead to selling pressure.
• Hover over individual bars to display the day's high and low along with other key metrics.
• 0DTE GEX Toggle: Toggle this feature for additional context on zero days to expiration options.
2. Heatmap:
Visualize options impact through three unique lenses: Gamma, Delta Pressure, & Charm Pressure
Gamma:
• Blue zones represent a more stable environment with higher gamma levels, leading to less price movement.
• Red zones indicate lower gamma levels, resulting in higher volatility and less stable prices.
• Pro Tip: Gamma can change throughout the day; we recommend checking this lens at least once per hour.
Delta Pressure:
• Blue zones below the current S&P price indicate supportive areas where buyers may enter.
• Blue zones above suggest areas where price can gain upward momentum.
• Red zones above the current price indicate resistance where sellers may enter.
• Red zones below highlight areas with potential for downward momentum.
Intensity Indicators:
• Denser contour lines and darker colors identify the largest areas of buying or selling pressure.
Charm Pressure:
• Most impacted by the passage of time, especially towards the end of the day.
• Red nodes indicate negative price pressure.
• Blue nodes show positive price pressure.
• The market often settles between darker red and blue zones.
• Larger nodes can be cross-referenced with the GEX Strike Plot to confirm potential closing areas.
Get started with SpotGamma here: https://bit.ly/3zj11ZO
Where Options Flow The Markets Go
###
SpotGamma is for stock traders, index traders, futures traders, and options traders who want high-caliber options data and clear, insightful analysis on what's really driving markets.
• Founder's Note with Expert Commentary
• Unique Support & Resistance Levels
• Daily Trading Ranges
• Index Charts with Key Levels
• Subscriber Q&A with SpotGamma Founder
• Online Office Hours for Traders of All Levels
• Delta, Vanna, & Gamma Models
• 0DTE Volume / Open Interest Indicator
• Monthly OPEX Analysis
• Trading Platform Integrations
• Discord Membership
•• Equity Hub
••• HIRO
••• Volatility Dashboard
••• TRACE
Choose your plan and get started today: https://bit.ly/3zj11ZO
—
STAY CONNECTED TO SPOTGAMMA
Website: https://spotgamma.com/
Academy: https://academy.spotgamma.com/
YouTube: https://www.youtube.com/c/spotgamma?s...
Twitter: / spotgamma
—
Get started with SpotGamma today: https://spotgamma.com/subscribe-to-sp...
*Note: This content is intended for general information and entertainment purposes only. No mention of company names, trading strategies or illustrative examples constitute investment advice. SpotGamma advises you to seek investment advice from a licensed professional.
###
Futures and forex trading contains substantial risk and is not for every investor. An investor could potentially lose all or more than the initial investment. Risk capital is money that can be lost without jeopardizing ones’ financial security or life style. Only risk capital should be used for trading and only those with sufficient risk capital should consider trading. Past performance is not necessarily indicative of future results.
Hypothetical performance results have many inherent limitations, some of which are described below. No representation is being made that any account will or is likely to achieve profits or losses similar to those shown; in fact, there are frequently sharp differences between hypothetical performance results and the actual results subsequently achieved by any particular trading program. One of the limitations of hypothetical performance results is that they are generally prepared with the benefit of hindsight. In addition, hypothetical trading does not involve financial risk, and no hypothetical trading record can completely account for the impact of financial risk of actual trading. for example, the ability to withstand losses or to adhere to a particular trading program in spite of trading losses are material points which can also adversely affect actual trading results. There are numerous other factors related to the markets in general or to the implementation of any specific trading program which cannot be fully accounted for in the preparation of hypothetical performance results and all which can adversely affect trading results.
Повторяем попытку...
Доступные форматы для скачивания:
Скачать видео
-
Информация по загрузке:


