"How to Plot XRD Data in Origin | Complete Step-by-step Tutorial"📉✨
Автор: CHEMICALS STORY
Загружено: 2026-06-24
Просмотров: 165
Описание:
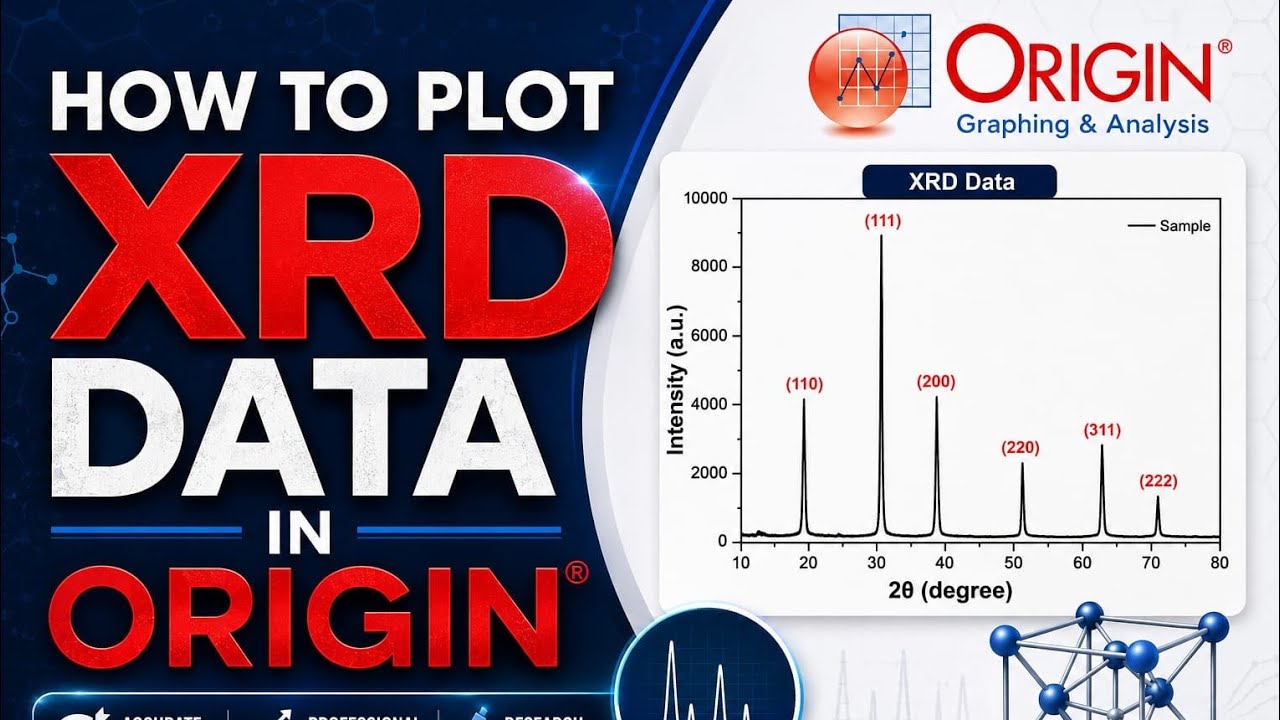
"How to Plot XRD Data in Origin | Complete Step-by-Step Tutorial"
In this video, a complete demonstration on how to plot "X-ray Diffraction (XRD) data in Origin"from raw experimental data is given . This tutorial is designed for students, researchers, and materials scientists who want to create professional-quality XRD graphs for research papers, thesis, dissertations, and presentations.
📌 " In this tutorial, you will learn:"
✅How to import raw XRD data into Origin
✅Formatting XRD datasets correctly
✅Plotting XRD intensity vs. 2θ graphs
✅Customizing axes, labels, fonts, and line styles
✅ Exporting high-resolution XRD figures
This tutorial is especially useful for researchers working in:
Materials Science
Nanotechnology
Chemistry
Physics
Electrochemistry
Energy Storage and Conversion
Research
🎓 Whether you are a beginner or an experienced researcher, this video will help you create clean, professional, and publication-ready XRD graphs in Origin.
👍 If you find this tutorial helpful, don't forget to Like, Share, and Subscribe for more research-related tutorials.
#XRD #OriginPro #OriginLab #XRayDiffraction #MaterialsScience #Nanotechnology #ResearchTutorial #DataAnalysis #ScientificResearch #GraphPlotting #OriginSoftware #ResearchTools #PhDResearch #ThesisWriting #Characterization #XRDAnalysis #ScientificGraphs #ResearchStudents #AcademicResearch
Повторяем попытку...
Доступные форматы для скачивания:
Скачать видео
-
Информация по загрузке: