Big O Notation Explained Visually (Animations for O(1), O(log n), O(n), O(n log n), O(n²))
Автор: TimeDora
Загружено: 2026-01-13
Просмотров: 1
Описание:
Create on Timedora.com using the prompt:
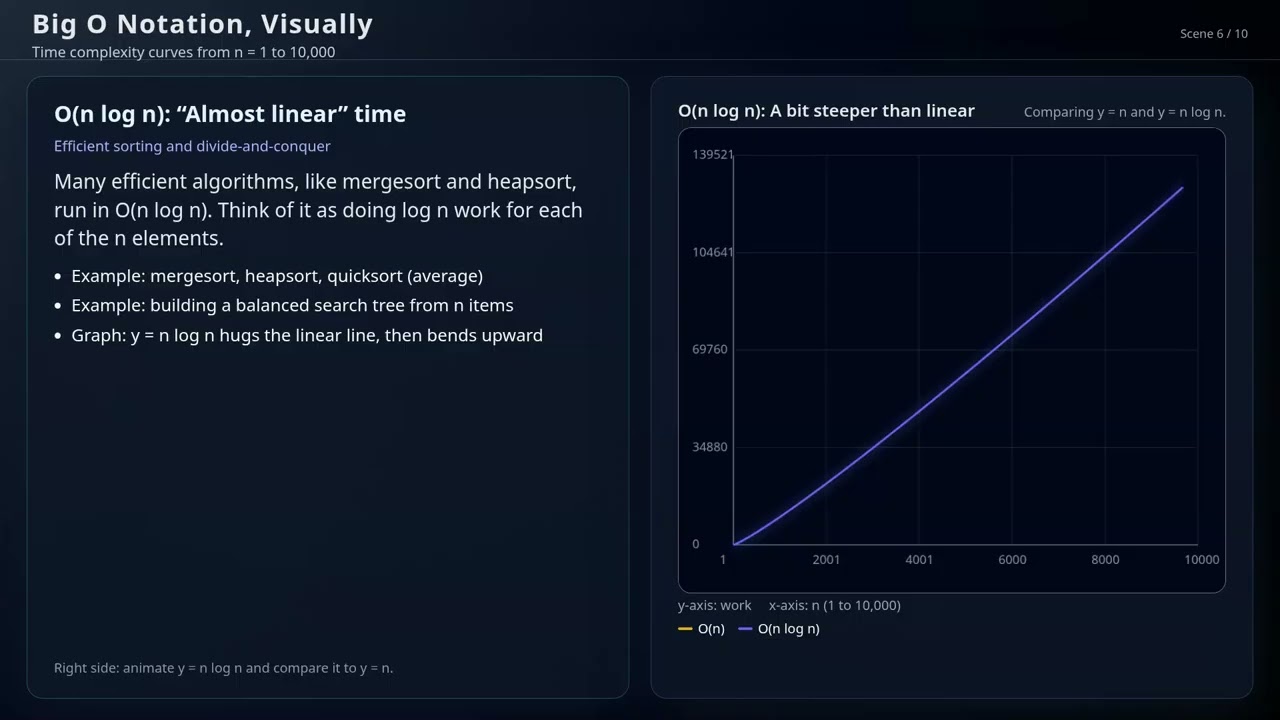
"create a youtube video teaching big o notation with about 10 different scenes. maximize the use of the screen space. Left half is the text and tutorial. Right half uses diagrams, animation and charts when necessary. For notation charges, use y axis as the work and x axis as n. Then if y=O(n), animate y=n as n gets bigger. or y=O(nlogn) , then animate and trace the path of y=n*log(n). Have n between 1-10000 and adjust y values accordingly for each."
Learn Big O notation with clear visual animations. In this video, we graph how algorithm work grows as input size n goes from 1 to 10,000. The left side walks through the concepts and real code-style examples; the right side shows animated curves for O(1), O(log n), O(n), O(n log n), and O(n²)—including a zoomed-in view so you can clearly see how they compare.
You’ll learn:
What Big O actually measures (work vs input size n)
Why we ignore constant factors and lower-order terms
How to recognize common time complexities in real code
How linear, n log n, and quadratic algorithms behave as n grows
How to use Big O as a quick “scalability sanity check” in design and code review
Повторяем попытку...
Доступные форматы для скачивания:
Скачать видео
-
Информация по загрузке:


