Tesla Engineer Shows AI How to "See" Time Series Data (Visual Diagnosis Method)
Автор: Fonzi AI Engineering Community
Загружено: 2026-02-17
Просмотров: 45
Описание:
Wassim from Tesla Energy's commercial UIs team had a simple observation: when engineers diagnose problems, they don't stare at CSV files. They graph things. They look for visual patterns, correlations, anomalies. They use their eyes.
So he built an experiment to teach LLMs to do the same thing.
His approach tests three ways for AI to work with time series data:
1. Summary statistics (mins, maxes, correlated changes)
2. Anomaly detection (standard stuff)
3. Screenshots (the interesting one)
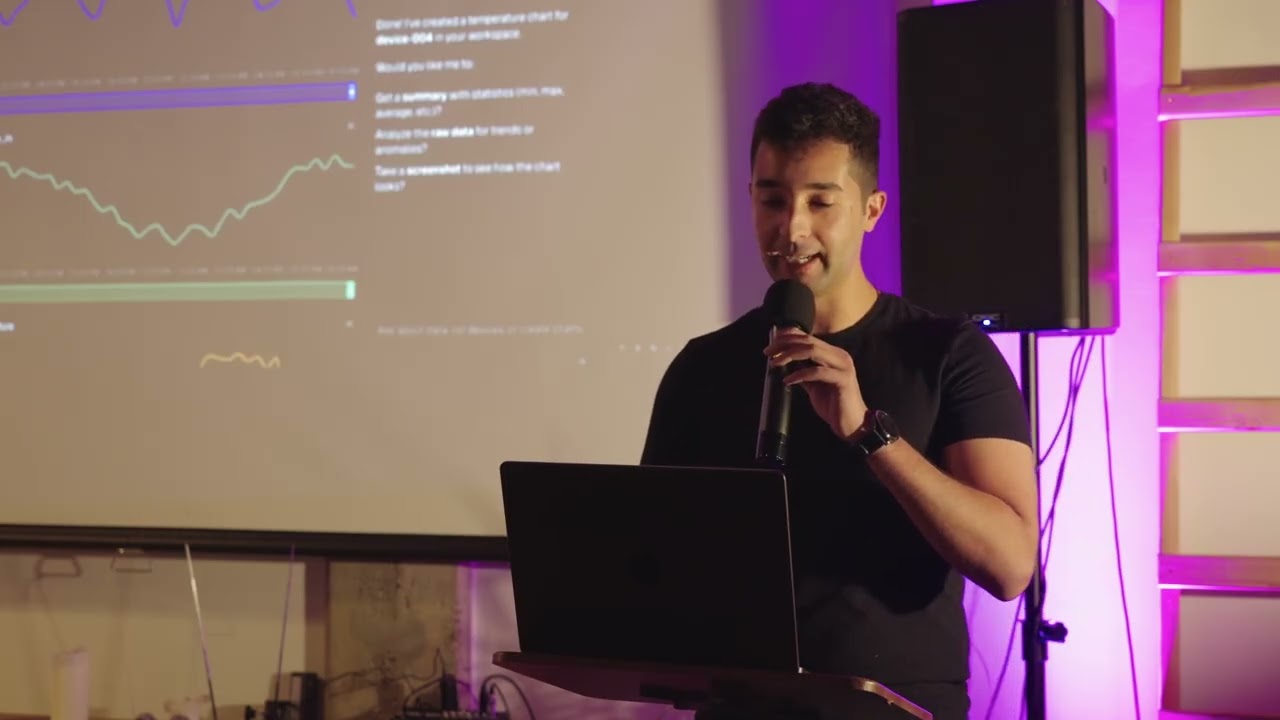
That third method is where it gets wild. Instead of feeding the AI raw time series data, he feeds it actual screenshots of the charts. The LLM analyzes the visual patterns just like an engineer would. It's vision-based diagnosis for technical systems.
The process: An engineer reports "this device is overheating" → LLM uses its tools to visually analyze the relevant charts → Provides diagnosis based on what it "sees."
Wasim built a full UI with all these modalities and demos the whole system. His hypothesis: vision is actually the best modality for this type of diagnostic work. The architecture is mostly tool calling, but the visual component changes everything.
His biggest takeaway mirrors what we've been hearing from other AI engineering leaders: building AI agents is less about coding and more about management. What tools do you give the agent? What data does it have access to? The quality of those decisions determines the quality of the AI's output.
This is the kind of real-world AI engineering we showcase at SF AI Engineers. Not theoretical papers or toy demos, actual production systems from engineers at companies like Tesla who are solving real problems with AI.
Timestamps
00:00 Wassim introduces Tesla Energy's commercial UIs team
00:14 Design exploration: LLMs for time series diagnosis
00:30 How engineers actually diagnose (visual patterns, not raw data)
01:00 Experiment: AI tools for time series exploration
01:16 Three modalities: stats, anomalies, and visual screenshots
01:54 Vision-based diagnosis hypothesis and tool-calling architecture
02:05 Demo: AI diagnosing device issues from engineer reports
02:16 Key insight: AI agents are about management, not coding
🗓 Come to our next meetup → https://www.meetup.com/san-francisco-...
💬 Join the Discord (where the convos keep going after the event) → / discord
💼 Looking for your next AI engineering role? Fonzi matches engineers with top AI companies → https://fonzi.ai
#Tesla #TeslaEnergy #TimeSeriesAnalysis #AIEngineering #LLM #VisualAI #AIAgents #DataVisualization #TechnicalDiagnosis #ProductionAI #SFTech #EnergyTech
Повторяем попытку...
Доступные форматы для скачивания:
Скачать видео
-
Информация по загрузке: