How to do Multiple Data Analyses using Multiple But Linked Pivot Tables Data eg of Sellout Data
Автор: Agush Nyang
Загружено: 2026-01-09
Просмотров: 23
Описание:
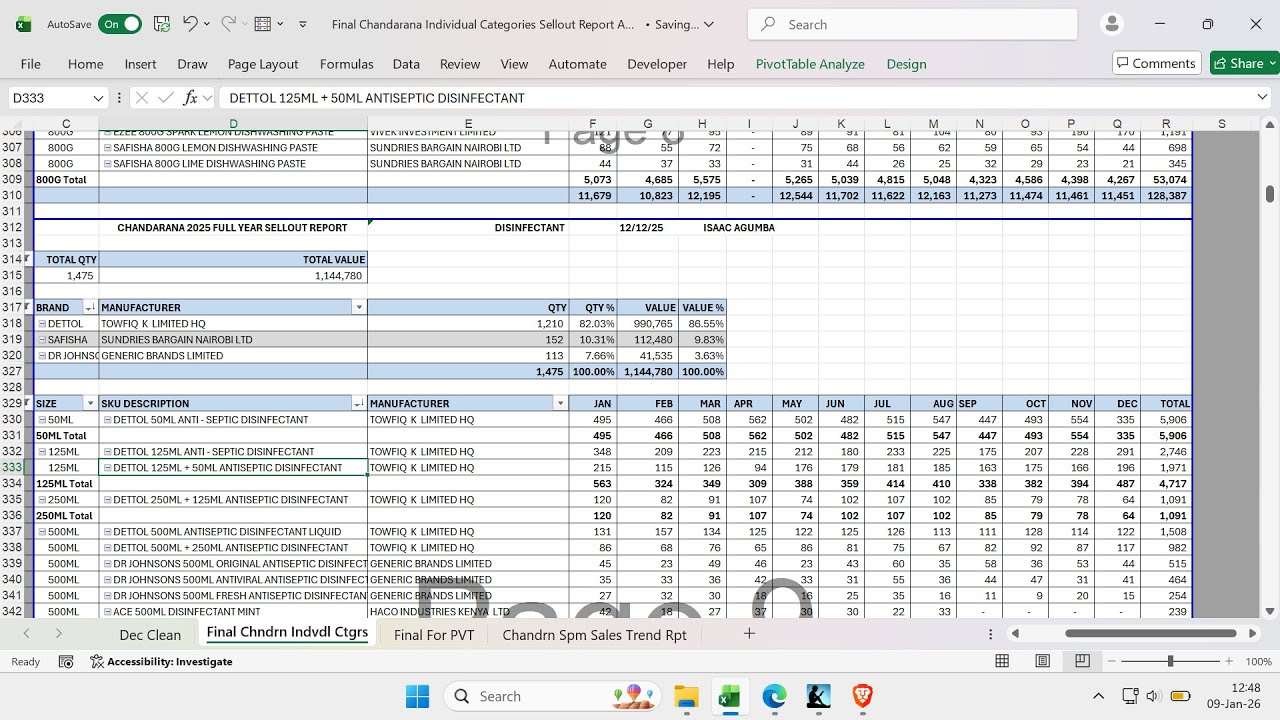
How to do Multiple Analyses using Multiple But Linked Pivot Tables Data eg Sellout Data of a firm with many Products of Different Categories
Lets say the firm Safisha Ltd produces cleaning products. They have different SKUs, almost 200 of different cleaning products such as Air Fresheners spray, toilet cleaners eg Harpic, Bleaches, Detergents, Dishwashing Liquid, Steelwool, etc. You (or mostly your boss, haha) need to see how they are performing against competitors: How each SKU is performing , Performed Last Month and has been M-O-M YTD, in terms of quantities (eg how many pcs, how many bottles of the Safisha Bleach 500ML Pine, cartons, ) sold, etc and the value of the sale of each, was.
We need to also see the market share of each, overall and in their category, last month and mom ytd, and against each competitor and competitors' products.
From Raw, unclean and impossible-whatsoever-to-understand-jumbled-random-numbers data to a very clean, clear, self-explanatory and visually appealing presentation, watch how you can do it yourself and borrow the idea to any kind of not only similar, but also (hell even) any kind of data analysis you might want to do, for it will basically give you an idea.
You can download the fully done workbook at https://1drv.ms/x/c/E133DA24F785B08F/... so you can even just copy paste your date, delete the rows, columns and sections you don't need, refresh and take to your boss. All for free.
I am Isaac Agumba, a data analyst and author of the East African bestseller novel called Agush Nyang and the Educational Book called Timmy's. You can google me and google those books and my other works, or simply go to booksonline.lovable.app .
For any help just email me on [email protected]
Повторяем попытку...
Доступные форматы для скачивания:
Скачать видео
-
Информация по загрузке:


![1 A.M Study Session 📚 [lofi hip hop]](https://image.4k-video.ru/id-video/lTRiuFIWV54)


