Graphing Trigonometric Functions sin x, cos x and tan x
Автор: Smart Alex Mathematics
Загружено: 2024-01-29
Просмотров: 7369
Описание:
#trigonometricfunction #graphing
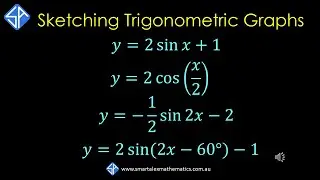
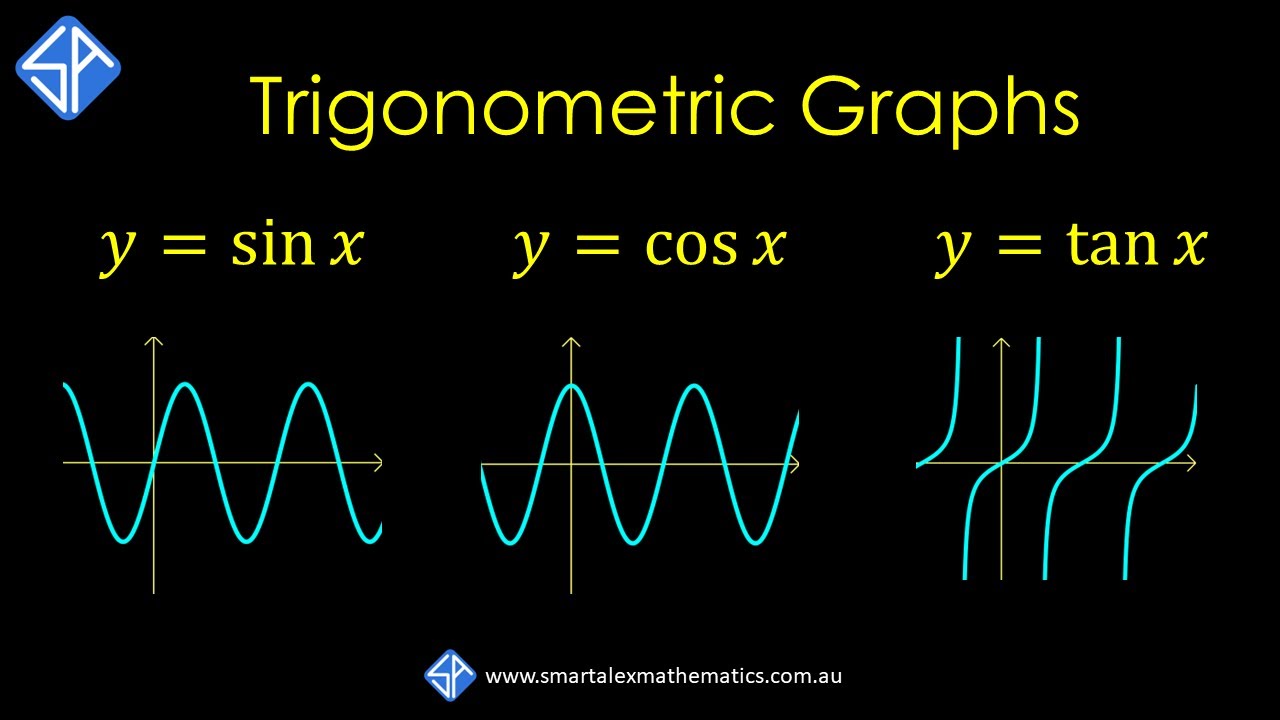
In this video, we look at how the sketch of the trigonometric graphs y = sin x, y = cos x and y = tan x was derived from the definition of the trigonometric functions using the unit circle.
The graph y = sin(theta) is derived from tracking the change in the y-coordinate as the angle theta rotates around the unit circle.
The graph y = cos(theta) is derived from tracking the change in the x-coordinate as the angle theta rotates around the unit circle.
The graph y = tan(theta) is derived from tracking the ratio y-coordinate/x-coordinate as the angle theta rotates around the unit circle.
Повторяем попытку...
Доступные форматы для скачивания:
Скачать видео
-
Информация по загрузке: