ycliper

Популярное

Музыка Кино и Анимация Автомобили Животные Спорт Путешествия Игры Юмор

Интересные видео

2025 Сериалы Трейлеры Новости Как сделать Видеоуроки Diy своими руками

Топ запросов

смотреть а4 schoolboy runaway турецкий сериал смотреть мультфильмы эдисон
Скачать

How to add Sparklines in Power BI Tables and Matrix Visualization?

Автор: Dhruvin Shah

Загружено: 2021-12-21

Просмотров: 16982

Описание: 
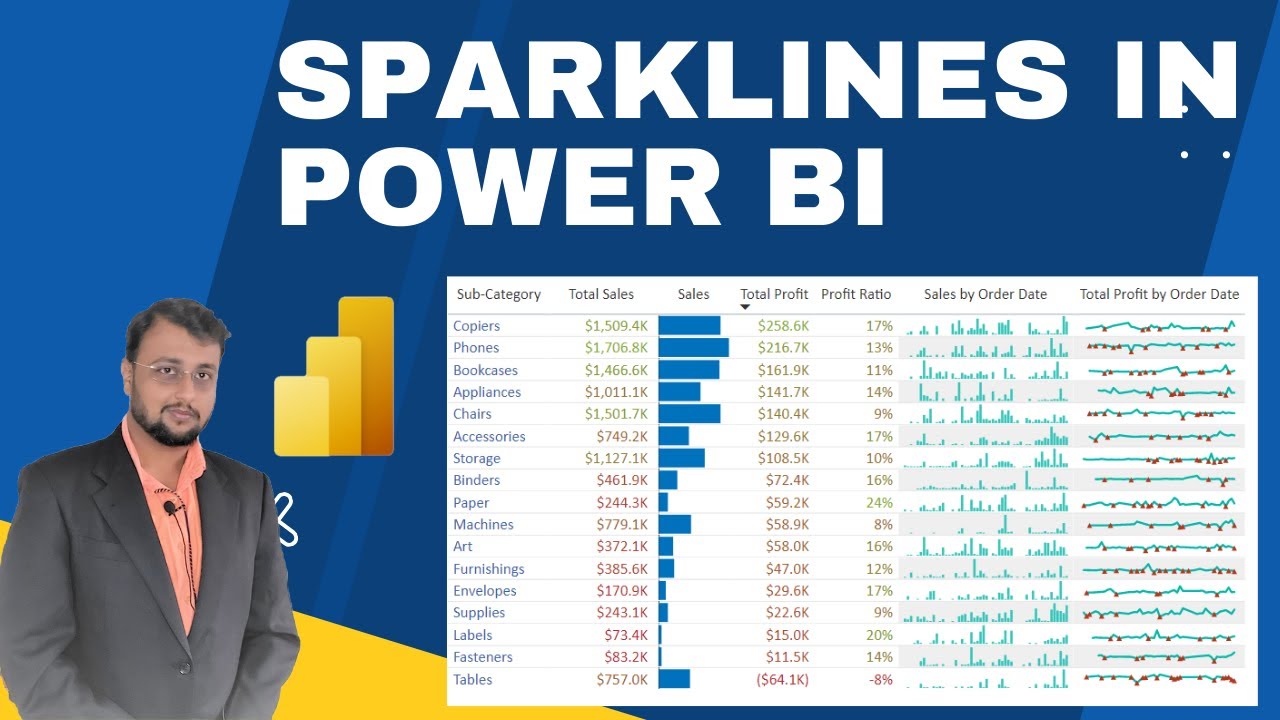
Welcome to Power BI December 2021 Feature Summary. This month Microsoft has rolled out one amazing feature for table and Matrix visual in Power BI. During this video, we will learn how we can add Sparklines for Tables and Matrix Visual? Now, we can add Sparklines for Power BI Tables and add Matrix. We don’t need to use any SVG concept to generate Sparklines in Power BI Desktop. So, Let’s get started and talk about this feature in detail!

Sparklines are tiny charts shown within cells of a table or matrix that make it easy to compare many trends quickly. We will talk about the start to end procedure for Power BI Sparklines. First, we will activate the Preview feature to add sparklines in Power BI Desktop. Then we will add two Sparklines in Table visual. After that, we will talk about different formatting options for Power BI Sparklines. At last, we will create the Sparklines for Matrix visual as well. So, stay tuned till the end.

Chapters:
00:00 Start
00:40 Intro
00:53 End Outcome for Sparklines
01:11 Sparklines in Power BI
02:16 Enable Preview Feature
02:41 Create Sparkline 1
03:15 Configure Sparkline in Power BI
04:06 Create Sparkline 2
04:31 Formatting for Sparklines
05:00 Show Sparklines as Column
05:58 Marker in Sparklines (Show Negative with highlighted Red Color)
07:13 Add Sparklines to Matrix Visual
07:39 Limitation of Sparklines with Matrix
09:05 Limitations for Sparklines
09:54 Subscribe!

#PowerBI #Sparklines #PowerBIDesktop #PowerBITip #DataAnalytics #PowerBISparklines #PowerPlatform #DigitalDhruvin #PowerAddicts

Follow me on Instagram:
  / powerplatformguy  

Looking for Consultancy? Connect Here!
https://powerplatformtrainings.com/co...

Follow me on all social Media Handles:
https://linktr.ee/dhruvin.shah

Не удается загрузить Youtube-плеер. Проверьте блокировку Youtube в вашей сети.
Повторяем попытку...
How to add Sparklines in Power BI Tables and Matrix Visualization?

Поделиться в:

Доступные форматы для скачивания:

Скачать видео

  • Информация по загрузке:

Скачать аудио

Похожие видео

SPARKLINES in Power BI | Make Your Report Shine Like Never Before

SPARKLINES in Power BI | Make Your Report Shine Like Never Before

Create IBCS-compliant tables using DEFAULT MATRIX visual and SVG // Beginners Guide to Power BI

Create IBCS-compliant tables using DEFAULT MATRIX visual and SVG // Beginners Guide to Power BI

Создайте панель срезов в Power BI как профессионал

Создайте панель срезов в Power BI как профессионал

Improve the Look and Feel of Tables and Matrix in Power BI

Improve the Look and Feel of Tables and Matrix in Power BI

Создайте свой собственный KPI SPARKLINE с использованием визуальных элементов по умолчанию в Powe...

Создайте свой собственный KPI SPARKLINE с использованием визуальных элементов по умолчанию в Powe...

ADVANCED Matrix Formatting I ALTERNATE Column or Row COLOR in Power BI

ADVANCED Matrix Formatting I ALTERNATE Column or Row COLOR in Power BI

Создание страницы отчета

Создание страницы отчета "Главная-Подробная информация" с фильтром детализации в Power BI.

Buttons, Selections and Bookmarks! Oh my!

Buttons, Selections and Bookmarks! Oh my!

10 советов по Power BI для создания более эффективных панелей мониторинга | Используете ли вы их ...

10 советов по Power BI для создания более эффективных панелей мониторинга | Используете ли вы их ...

ОСВОЕНИЕ столбчатых диаграмм в Power BI | Больше никаких вырезаемых меток

ОСВОЕНИЕ столбчатых диаграмм в Power BI | Больше никаких вырезаемых меток

How to Build Power BI Reports from Start to Finish

How to Build Power BI Reports from Start to Finish

Sci-Fi Fantasy Short Film:

Sci-Fi Fantasy Short Film: "Résistance" | DUST

How MCP is Transforming Power BI & Fabric Analytics | Real-World Demo

How MCP is Transforming Power BI & Fabric Analytics | Real-World Demo

Power BI Tutorial 2026 | Full Beginner to Advanced Step by Step Series| Episode 1

Power BI Tutorial 2026 | Full Beginner to Advanced Step by Step Series| Episode 1

Stop Using Boring KPI Visual in Power BI! (Better KPI Design Tutorial)

Stop Using Boring KPI Visual in Power BI! (Better KPI Design Tutorial)

Trend Visualization in Power BI

Trend Visualization in Power BI

📊 How to use Power BI DAX - Tutorial

📊 How to use Power BI DAX - Tutorial

5 WAYS to use BOOKMARKS in Power BI

5 WAYS to use BOOKMARKS in Power BI

How to design EYE-CATCHING Tables (or Matrix) in Power BI // Beginners Guide to Power BI in 2023

How to design EYE-CATCHING Tables (or Matrix) in Power BI // Beginners Guide to Power BI in 2023

Учебные материалы по Power BI | Карточка KPI — проект | Расширенные возможности Power BI для анал...

Учебные материалы по Power BI | Карточка KPI — проект | Расширенные возможности Power BI для анал...

© 2025 ycliper. Все права защищены.


  • Контакты
  • О нас
  • Политика конфиденциальности


Контакты для правообладателей: [email protected]