Data Stream | Custom Charts
Автор: Retail Control Systems - Retail Technology
Загружено: 2026-02-11
Просмотров: 0
Описание:
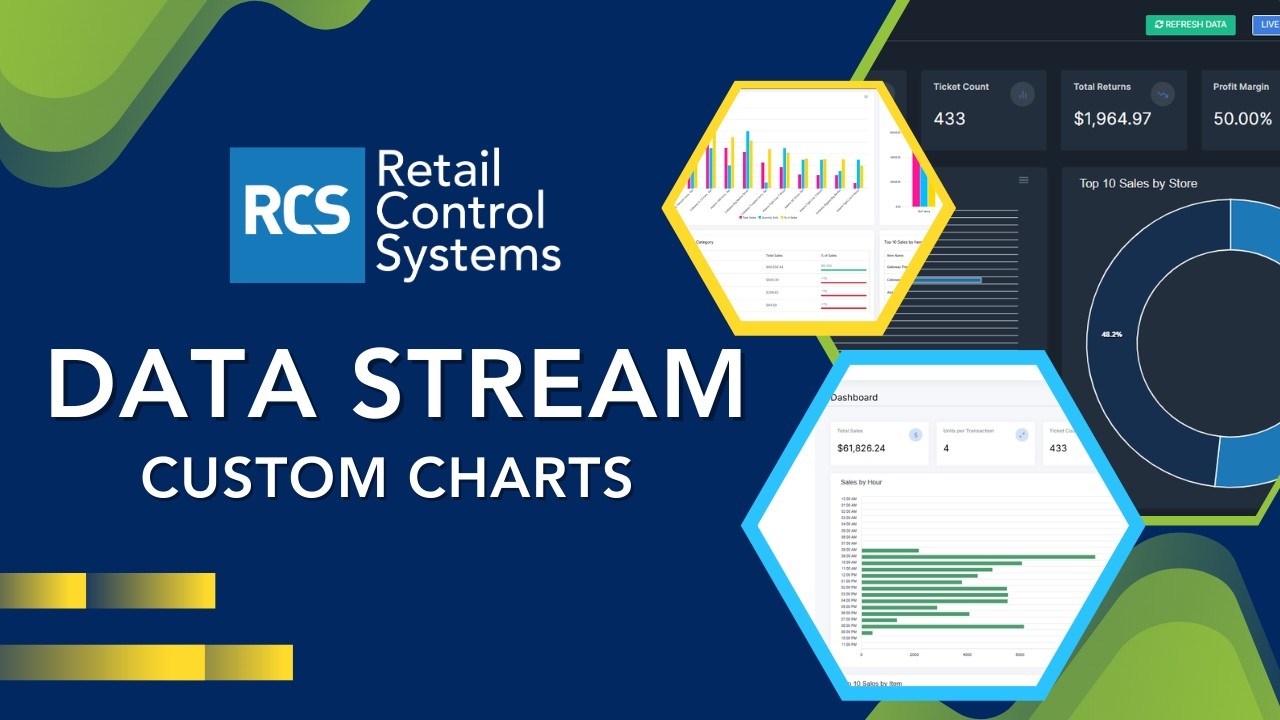
In this webinar: Transform raw numbers into actionable insights. Learn how to create, group, and preview custom visual charts for inventory and sales analysis.
Summary: Data is more powerful when it's easy to digest. In this tutorial, we show you how to use DataStream Charts to create professional visualizations of your Counterpoint data. Learn how to turn your quantity-on-hand reports into donut charts, bar graphs, and more. We cover how to group data by item, category, or description and how to download these visuals for your next board meeting or internal presentation. Turn your retail data into a visual story that drives better business decisions.
About Us: Retail Control Systems (RCS) is a premier point of sale provider, driving retailer growth with cutting-edge technology solutions and best-in-class support. We are dedicated to helping your unique business needs.
ADDITIONAL CONTENT TO CONSIDER:
Sign up for the RCS monthly newsletter! https://www.retailcontrolsystems.com/...
Read more about RCS retail POS solutions: https://www.retailcontrolsystems.com/...
NCR Counterpoint’s Robust Reporting Tools: https://www.retailcontrolsystems.com/...
Unleash the Power of Your Counterpoint POS System with Inspection Services: https://www.retailcontrolsystems.com/...
How NCR Counterpoint Elevates Sporting Goods Retailers: https://www.retailcontrolsystems.com/...
Keep in touch and follow us on social:
LinkedIn: / retail-control-systems
Disclaimer: The videos on our YouTube channel are for informational purposes only and are not intended as an endorsement for any of the products or services that we feature.
Повторяем попытку...
Доступные форматы для скачивания:
Скачать видео
-
Информация по загрузке: