Make Interactive Excel Dashboard in Just 9 Minutes (2026)
Автор: Dani Insights
Загружено: 2026-02-08
Просмотров: 377
Описание:
🚀 Learn how to create a professional and interactive Excel Sales Analytics Dashboard in just 9 minutes! This step-by-step tutorial will guide you through:
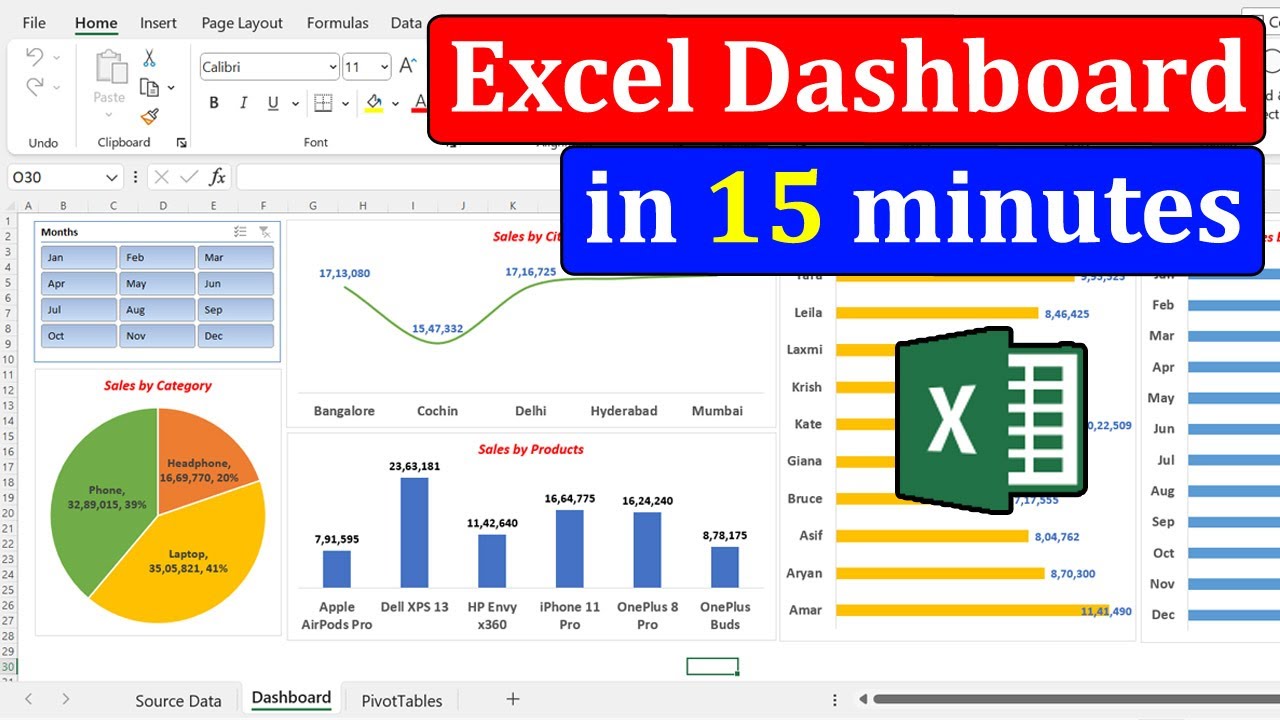
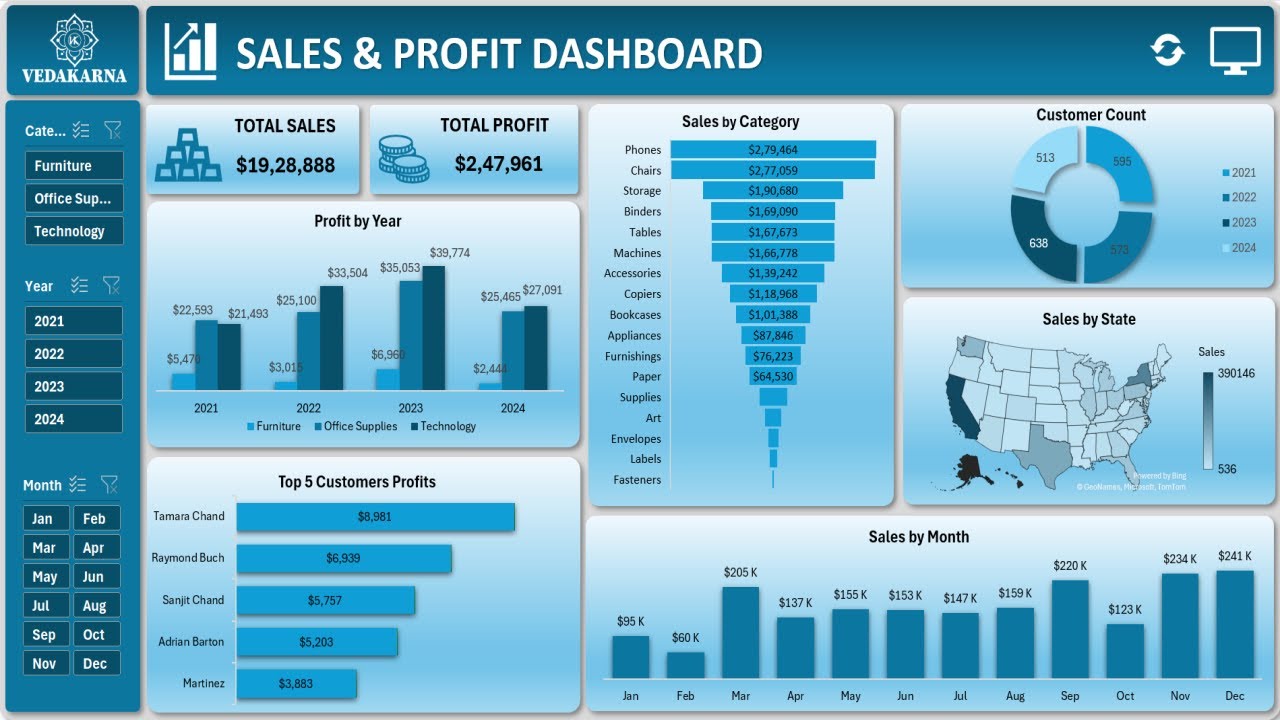
Designing a clean and visually appealing dashboard
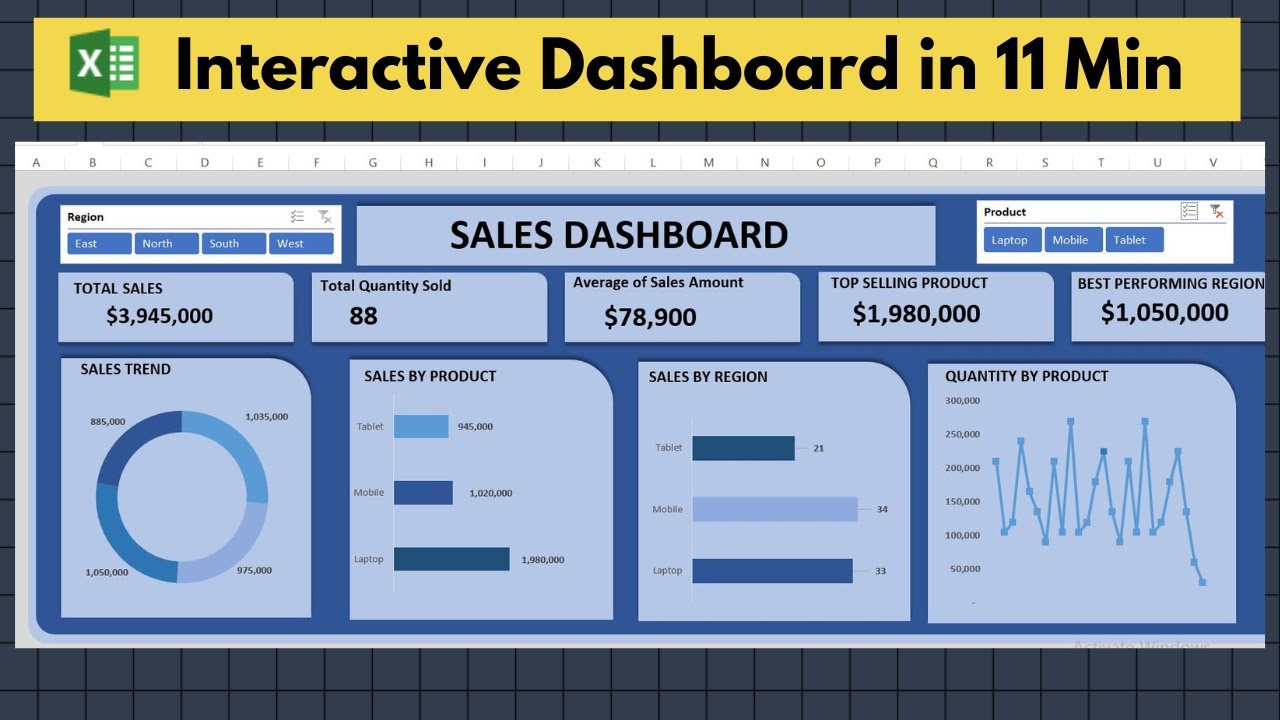
Adding sales, profit, and customer analytics
Creating charts by month and region
Making your dashboard interactive using Excel slicers
Perfect for business analysts, students, and Excel enthusiasts looking to level up their data visualization skills.
📌 Download the example file: Link will be added soon
📌 Subscribe for more Excel tutorials: / @daniinsights-g3w
Let’s Connect & Grow Together:
🔹 Explore my Blog for detailed guides: https://daniinsight.com/
🔹 Connect professionally on LinkedIn: / daniyalrb
🔹 Get more ideas on Pinterest: / daniyal000
#ExcelDashboard #ExcelTutorial #DataAnalytics #SalesDashboard #InteractiveDashboard #ExcelTips #BusinessAnalytics #ExcelCharts #Dashboard2026 #LearnExcel
Повторяем попытку...

Доступные форматы для скачивания:
Скачать видео
-
Информация по загрузке: