How to Create Dynamic Graph Visualization with Pyqtgraph Inside Qvboxlayout
Автор: Albiemer Hub
Загружено: 2024-02-26
Просмотров: 568
Описание:
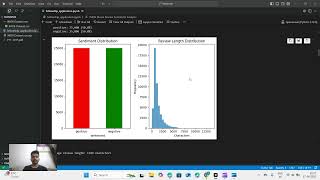
In this tutorial, you’ll explore how to create dynamic graph visualizations using PyQtGraph inside a QVBoxLayout. Learn how to integrate PyQtGraph with QVBoxLayout for building responsive graphs that adapt to real-time data updates.
What You'll Learn:
Setting up PyQtGraph in a PyQt6 application
Designing a layout with QVBoxLayout in QtDesigner
Implementing dynamic graph visualizations that update based on data
Handling real-time updates and adapting graphs to changing inputs
Why Choose This Tutorial:
Beginner-friendly: Step-by-step instructions for integrating PyQtGraph with QVBoxLayout
Comprehensive guide: Learn how to implement live graph updates in your PyQt applications
Real-world application: Enhance your applications with dynamic graphing and interactive data visualizations
Ready to enhance your PyQt applications with powerful data visualizations? Let’s dive in and get started on creating dynamic graphs that update in real-time!
Source Code & Files
https://albiemer.netlify.app/tutorial27
#Python #PyQt6 #PyQtGraph #QVBoxLayout #DataVisualization #GUI #PythonDevelopment
Повторяем попытку...

Доступные форматы для скачивания:
Скачать видео
-
Информация по загрузке: