Data Visualization with Pandas and Matplotlib: "Seeing stats in a new light"
Автор: Lorena Barba
Загружено: 2025-05-14
Просмотров: 110
Описание:
EngComp Module 2, Lesson 2: "Seeing stats in a new light"
(Edited from a live class via Zoom on March 2, 2021, for my Engineering Computations course at the George Washington University.)
Corresponding written lesson at: http://go.gwu.edu/engcomp2lesson2
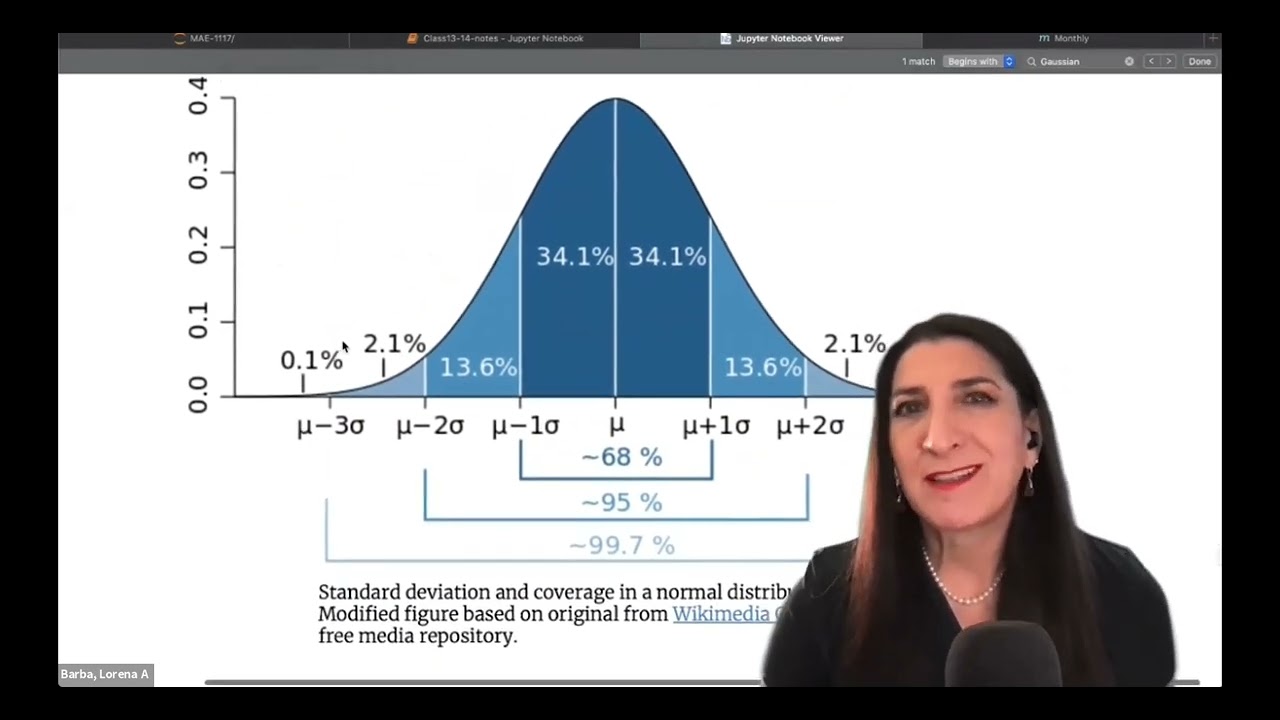
In this video, we continue our exploration of data visualization using Pandas and Matplotlib. We use various techniques to analyze and represent quantitative data, such as histograms, box plots, and computing statistics like variance and median. The lesson starts with a recap of setting up the necessary libraries (NumPy, Pandas, and Matplotlib) and revisits key data cleaning steps for the beers dataset. We then look into categorical data visualization using bar plots, analyze the style of beers, and discuss computation of statistical metrics. We also learn about box plots and their significance in displaying data distribution. Follow along to enhance your data science skills, and learn efficient ways to visualize and analyze data!
00:00 Introduction to Data Visualization with Pandas and Matplotlib
00:12 Review of Import Statements and Initial Setup
01:31 Understanding Quantitative Data
03:30 Cleaning and Preparing Data for Analysis
05:06 Plotting Histograms with Pandas
07:45 Using NumPy for Statistical Calculations
17:51 Exploring Box Plots for Data Distribution
27:38 Introduction to Categorical Data
27:52 Visualizing Categorical Data with Bar Plots
Повторяем попытку...

Доступные форматы для скачивания:
Скачать видео
-
Информация по загрузке: