E-Commerce Sales Dashboard – Full Power BI Build: Data Prep, DAX & Interactive Visuals
Автор: Freedom Oboh
Загружено: 2025-08-29
Просмотров: 8468
Описание:
#powerbi #powerbidashboard #dashboarddesign
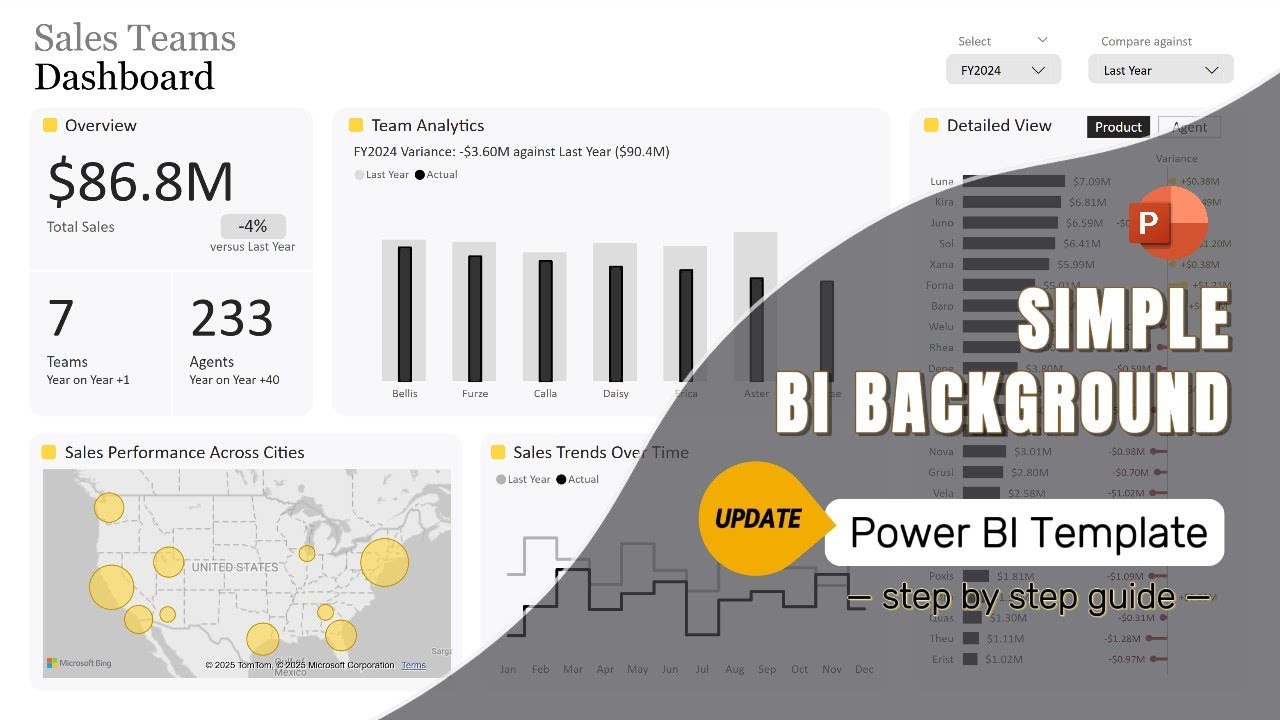
In this complete guide, we take raw e-commerce sales data and transform it into a fully functional Power BI dashboard. From data preparation in Power Query, creating DAX measures, building interactive visuals, and structuring the dashboard, to wireframing in PowerPoint, this video covers the entire workflow.
Work With Me
I help businesses and individuals make sense of their data with dashboards, trackers, and custom solutions and excel coaching.
📩 To work with me, send a message to:
📱 WhatsApp / iMessage: +234 816 299 8619
✉️ Email: [email protected]
Whether you’re an aspiring data analyst or just want to make sense of your sales data, this dashboard shows how to turn numbers into actionable insights.
Resources:
Dataset: https://drive.google.com/drive/folder...
Natural Earth: https://www.naturalearthdata.com/
Map Shaper : https://mapshaper.org/
Color Picker: https://imagecolorpicker.com/
Icons: https://www.flaticon.com/
What you’ll learn:
• Importing and cleaning sales data in Power Query
• Writing DAX measures for KPIs like Sales, Profit, Orders, and Quantity
• Creating an interactive Power BI dashboard
• Using custom map charts, icons, and color palettes
• Wireframing dashboard layouts in PowerPoint for better planning
• Formatting visuals, including rounded bar charts and error bars
Time Stamps:
00:00 - Introduction
02:35 - Import Text/CSV file using Power Query
05:20 - Clean and Transform Data in Power Query
16:40 - Write DAX measures for KPIs
20:45 - Build Data Model
31:46 - Test DAX measures with slicers
33:36 - Wireframing Dashboard Layout in PowerPoint
47:00 - Import PNG as Canva Background
48:00 - Import Custom Map Chart (JSON file)
52:41 - Add Cards and Visuals
1:00:15 - Format Bar Chart with Error Bars for KPI
1:03:00 - Insert Line Chart for KPI
1:05:00 - Insert & Format Area Chart
1:07:00 - Insert & Format Donut Chart
1:12:40 - Insert & Format Rounded Bar Charts
1:17:00 - Test Interactivity of Dashboard
1:18:00 - Outro
Connect with me:
LinkedIn: / freedomoboh
X (Twitter): https://x.com/ObohX
YouTube: / @obohyt
TikTok: / obohtt
👉 If you found this helpful, don’t forget to LIKE 👍, COMMENT 💬, and SUBSCRIBE 🔔 for more Excel, Power BI, and data analytics content.
Let's keep building data stories that matter.
#microsoft #datastorytelling #datavisualization #freedomoboh #howto
Повторяем попытку...

Доступные форматы для скачивания:
Скачать видео
-
Информация по загрузке: