BU Bridge at Comm. Ave - Plan 1: Add pedestrian and bike protection, but with strong spillback risk
Автор: Fatemeh Tabatabaei
Загружено: 2024-12-18
Просмотров: 6
Описание:
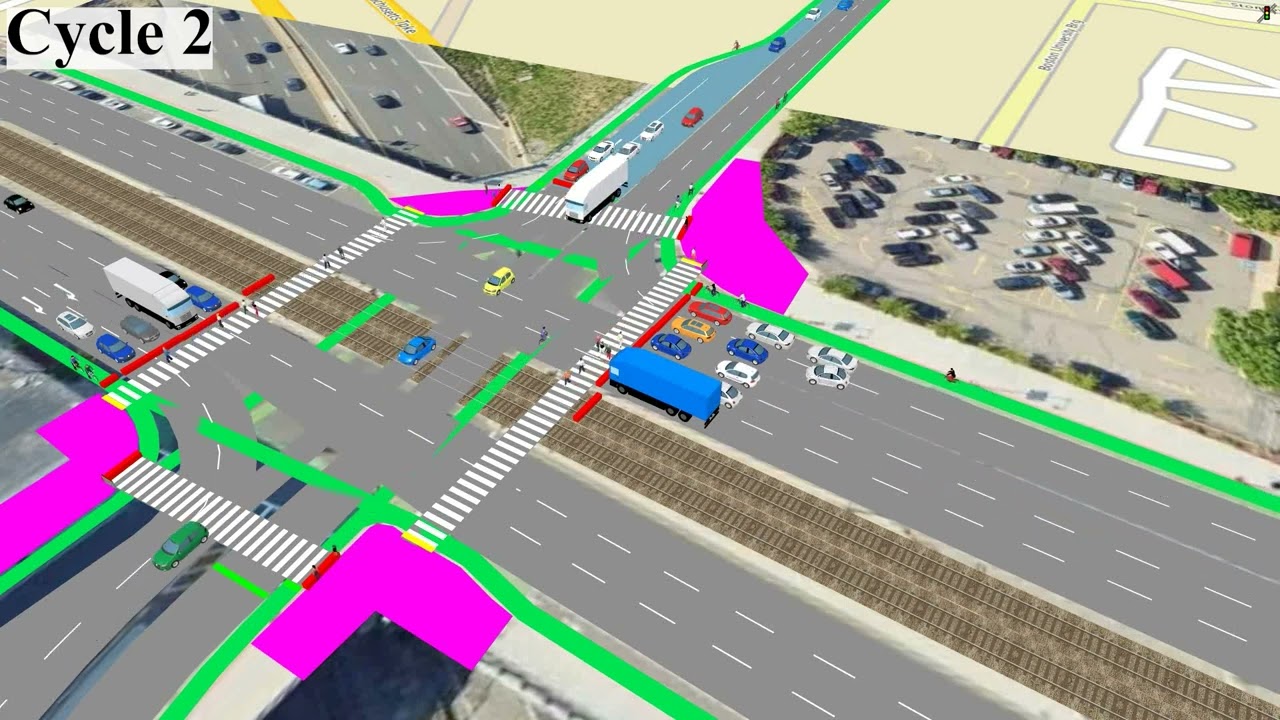
Where Boston University (BU) bridge reaches Commonwealth Avenue, there are both safety and capacity problems associated with the southbound approach to Comm. Ave. ( • Current Plan: Partial Protection for Peds,... ). Vulnerable road users are not protected at this intersection while crossing the western leg. The capacity is neither sufficient for vehicles, resulting in the queue spill back over the bridge and spill into the rotary on the other end, creating a dangerous and devastating situation.
Observations indicate that the auxiliary through lane is hardly used and right turning volume is relatively high. Therefore, Boston transportation engineers proposed a plan with two short right turn lanes and one through lane on southbound approach at BU bridge. The bike lane are moved to the right side of right turning lanes, and are to be protected by flex posts.
In this plan, pedestrians and bikes are fully protected while crossing Commonwealth Avenue. Southbound right turning phase begins later than the southbound through green phase, giving the short lanes more time (48 seconds) to have right turning vehicles staked-up in the short lane.
However, the long red for right-turns means that the right turning vehicles may spill back beyond the short lane length and blocked the through continuous lane, even though there are two right-turn lanes. The risk of spill back is apparent in the first cycle of the video, while spillback actually occurs during the second cycle, causing starvation for 33 seconds.
If the simulation runs for many cycles, right turn lanes block the through lane for 57% of cycles for an average of 30 seconds (starvation caused by the spillback), leaving the bus delay problem and congestion over the bridge unsolved.
In this video, 30 vehicles can discharge from BU bridge per each cycle of 120 seconds. While it is expected for thew capacity to increase if the simulation keeps running for many cycles, the observed capacity will be 885 vehicles per hour.
Повторяем попытку...
Доступные форматы для скачивания:
Скачать видео
-
Информация по загрузке:


