vMix: Data Driven Bar Charts with Dynamic Motion
Автор: Streaming Alchemy
Загружено: 2024-08-16
Просмотров: 1488
Описание:
Click Here: https://callin.cloud/streamingalchemy if you would like to join us through Video Call-In to ask a question or to comment on something in the show.
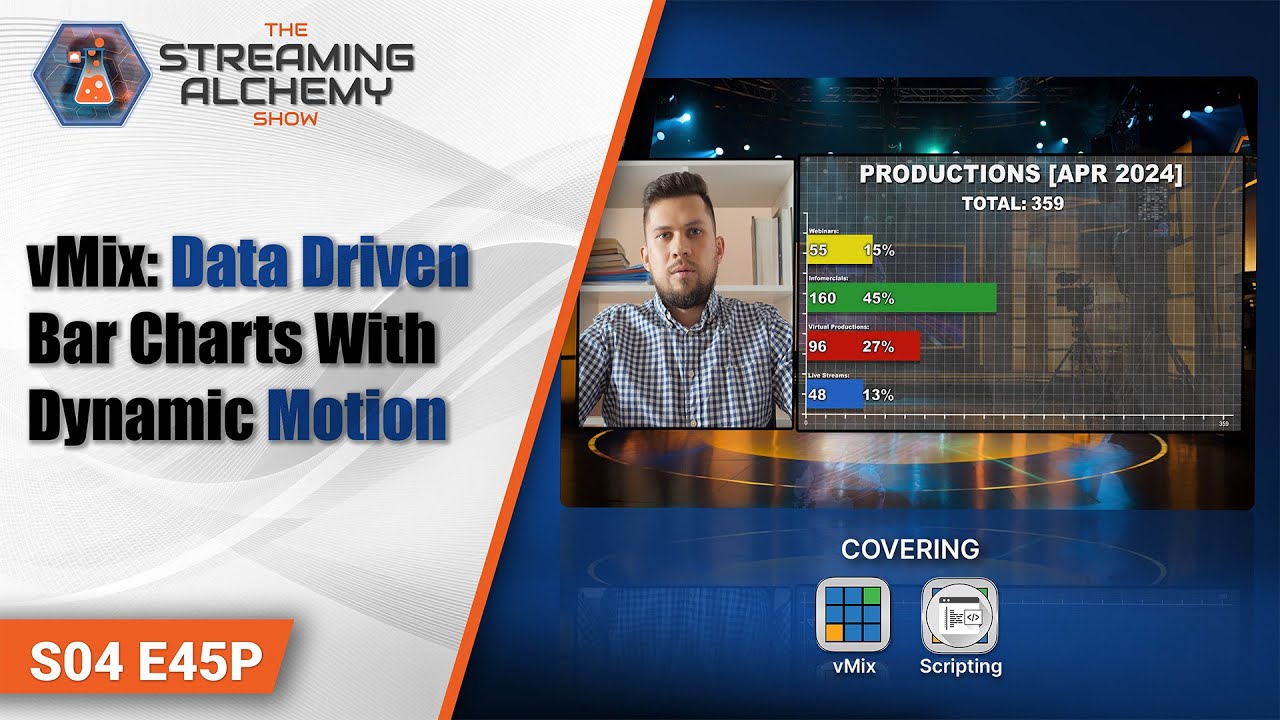
Bar Charts are a common tool to graphically represent the relative sizes of related sets of numbers. They can be used to display vote tallies in election coverage, performance numbers in sales presentations, or for any display that needs to track changes in values over time.
On today’s show, we’ll show you how to create data driven Bar Charts in vMix, pulling data sets from an Excel Data Source and smoothly sliding bars on the graph to reflect changes in the underlying data. All of this will be handled with some straight-forward scripting and a bit of help from the incredibly useful MERGE transition.
If you'd like to access any of the scripts used during our shows, here is the link to our Streaming Alchemy GitHub Repository:
https://github.com/StreamingAlchemy/S...
Google Drive:
https://drive.google.com/drive/folder...
Enjoy them. Share them. Improve them!
If you'd like to access the vMix Preset and Scripts used during today’s show, here is the link:
https://drive.google.com/drive/folder...
Thanks for joining us for the show!
Повторяем попытку...
Доступные форматы для скачивания:
Скачать видео
-
Информация по загрузке:
![VMIX REPLAY [Part TWO]: A DEDICATED OPERATOR VIEW](https://image.4k-video.ru/id-video/nwLBDBpAINI)


