Data Transformation (Log, square root, cube root, Tukey Ladder, and Boxcox methods ) In R studio
Автор: Wakjira Tesfahun
Загружено: 2021-12-02
Просмотров: 6411
Описание:
Data Transforming
Most parametric tests require that residuals be normally distributed and that the residuals be homoscedastic. One approach when residuals fail to meet these conditions is to transform one or more variables to better follow a normal distribution. Often, just the dependent variable in a model will need to be transformed. However, in complex models and multiple regression, it is sometimes helpful to transform both dependent and independent variables that deviate greatly from a normal distribution.
There is nothing illicit in transforming variables, but you must be careful about how the results from analyses with transformed variables are reported. For example, looking at the turbidity of water across three locations, you might report, “Locations showed a significant difference in log-transformed turbidity.” To present means or other summary statistics, you might present the mean of transformed values, or back transform means to their original units.
Some measurements in nature are naturally normally distributed. Other measurements are naturally log-normally distributed. These include some natural pollutants in water: There may be many low values with fewer high values and even fewer very high values.
For right-skewed data—tail is on the right, positive skew, common transformations include square root, cube root, and log.
For left-skewed data—tail is on the left, negative skew—, common transformations include square root (constant – x), cube root (constant – x), and log (constant – x).
Because log (0) is undefined—as is the log of any negative number—, when using a log transformation, a constant should be added to all values to make them all positive before the transformation. It is also sometimes helpful to add a constant when using other transformations.
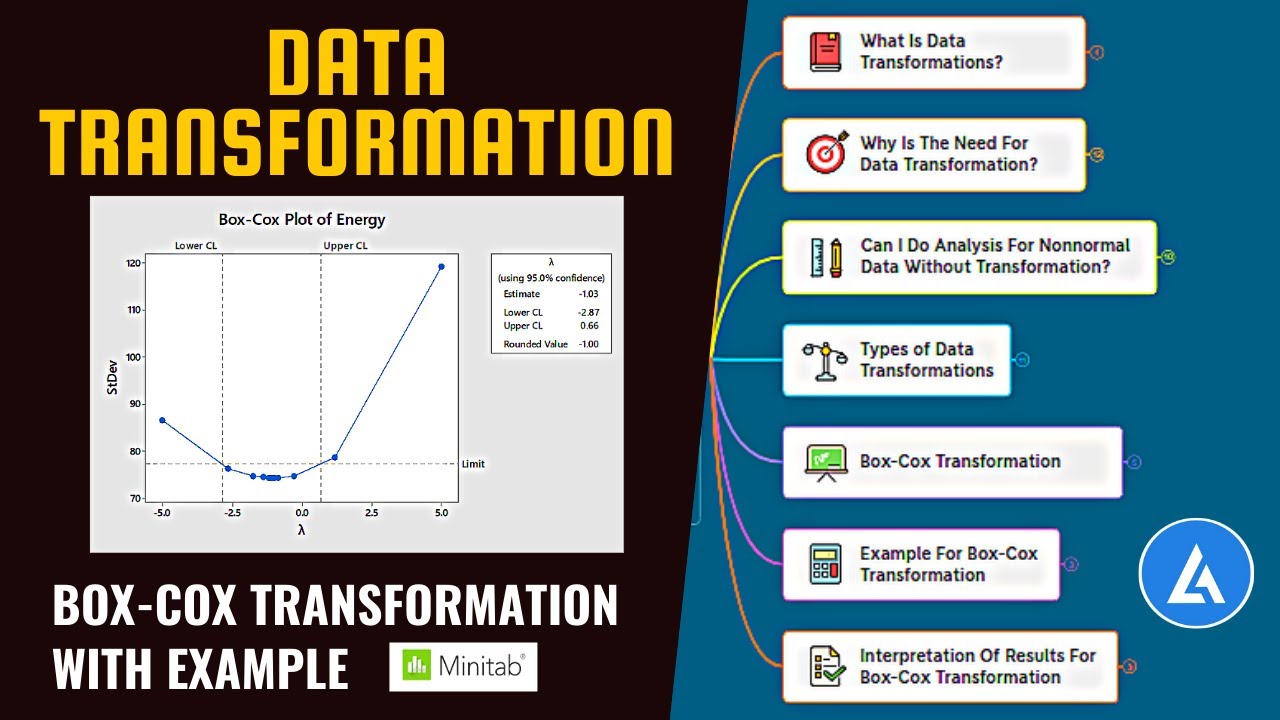
Another approach is to use a general power transformation, such as Tukey’s Ladder of Powers or a Box-Cox transformation. These determine a lambda value, which is used as the power coefficient to transform values. X.new = X ^ lambda for Tukey, and X.new = (X ^ lambda – 1) / lambda for Box–Cox.
The function transformTukey in the rcompanion package finds the lambda which makes a single vector of values—that is, one variable—as normally distributed as possible with a simple power transformation.
The Box–Cox procedure is included in the MASS package with the function boxcox. It uses a log-likelihood procedure to find the lambda to use to transform the dependent variable for a linear model (such as an ANOVA or linear regression). It can also be used on a single vector.
Packages used in these tutors
The packages used in this chapter include:
• MASS
• rcompanion
• psych
The following commands will install these packages if they are not already installed:
if(!require(MASS)){install.packages("MASS")}
if(!require(rcompanion)){install.packages("rcompanion")}
if(!require(psych)){install.packages("psych")}
the scrpit for this tutorials!
Data transformation
data=c(1,3,4,5,6,100,233,1000,1500,2000,10000,45000,9000,12000,20000)
library(rcompanion)
plotNormalHistogram(data)
qqnorm(data)
qqline(data,col="blue")
#Square root transformation
data_sqrt= sqrt(data)
library(psych)
skew(data)
plotNormalHistogram(data_sqrt)
#Cube root transformation
data_cub=sign(data) * abs(data)^(1/3)
plotNormalHistogram(data_cub)
#Log transformation
data_log =log(data)
plotNormalHistogram(data_log)
#Tukey's Ladder of Powers transformation
data_tuk =transformTukey(data,plotit=TRUE)
plotNormalHistogram(data_tuk)
#Box-Cox transformation
library(MASS)
Box = boxcox(data~ 1,lambda= seq(-2,2,0.1))
Create a data frame with the results
Cox = data.frame(Box$x, Box$y)
Order the new data frame by decreasing y
Cox2 = Cox[with(Cox, order(-Cox$Box.y)),]
Display the lambda with the greatest
Cox2[1,]
Extract that lambda
lambda = Cox2[1,"Box.x"]
Transform the original data
data_box=(data^lambda-1)/lambda
plotNormalHistogram(data_box)
Повторяем попытку...

Доступные форматы для скачивания:
Скачать видео
-
Информация по загрузке: