Global Energy Use by Source (1965–2024)
Автор: ChartedTV™
Загружено: 2026-01-26
Просмотров: 4
Описание:
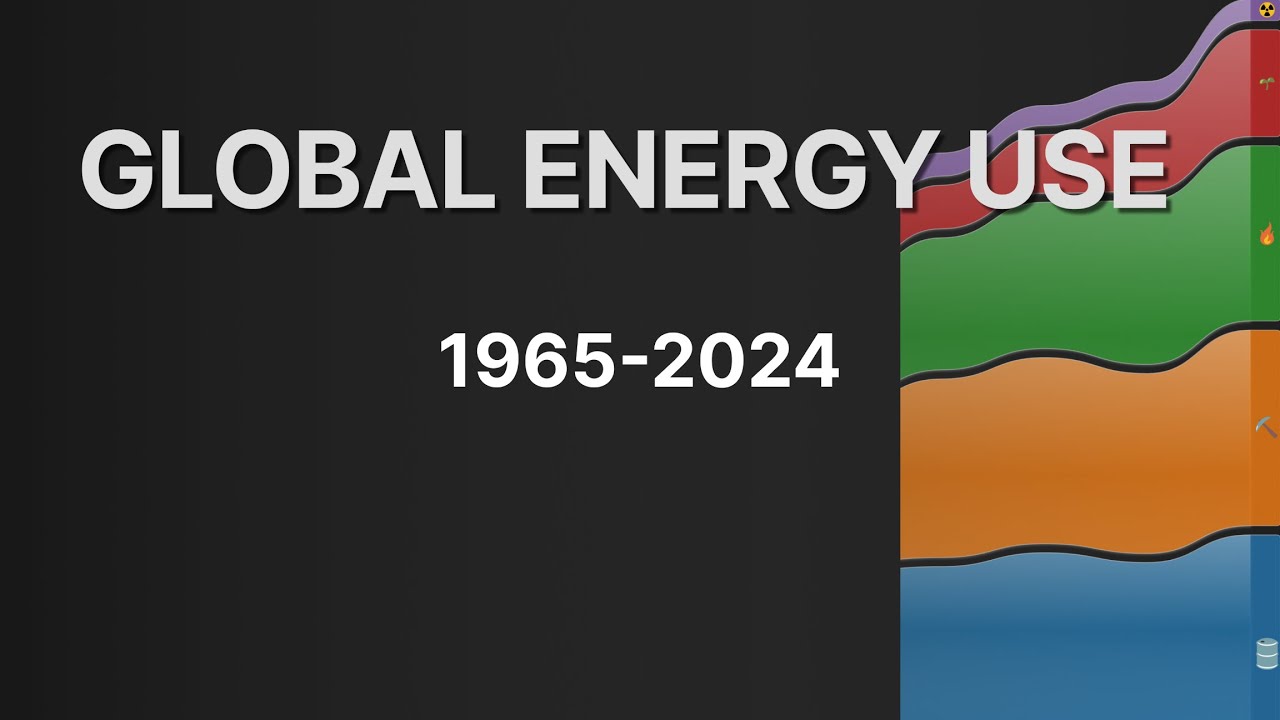
How has the world’s energy system actually changed over time?
This chart shows global primary energy consumption by source — oil, coal, gas, nuclear, and renewables — from 1965 to 2024.
Rather than focusing on short-term trends or headlines, it visualises the long-term structure of the global energy mix and how different sources have grown, stabilised, or declined over decades.
Data: Our World in Data
Units: Terawatt-hours (TWh)
00:06 Post-war era
00:11 The 1970s
00:23 The 1980s
00:38 Post–Cold War
00:48 Early 2000s
01:00 The 2010s
01:18 Today
Note: “Renewables” include hydro and bioenergy, consistent with standard primary energy definitions.
Повторяем попытку...
Доступные форматы для скачивания:
Скачать видео
-
Информация по загрузке:


