Скачать
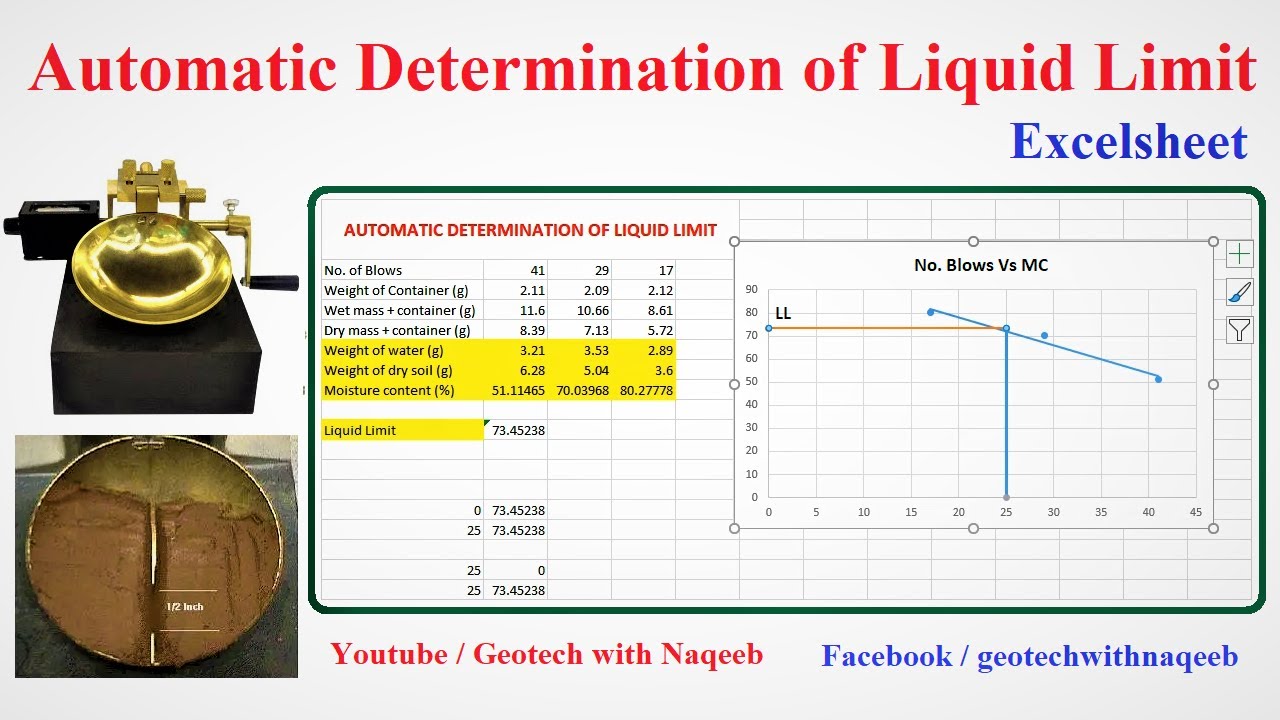
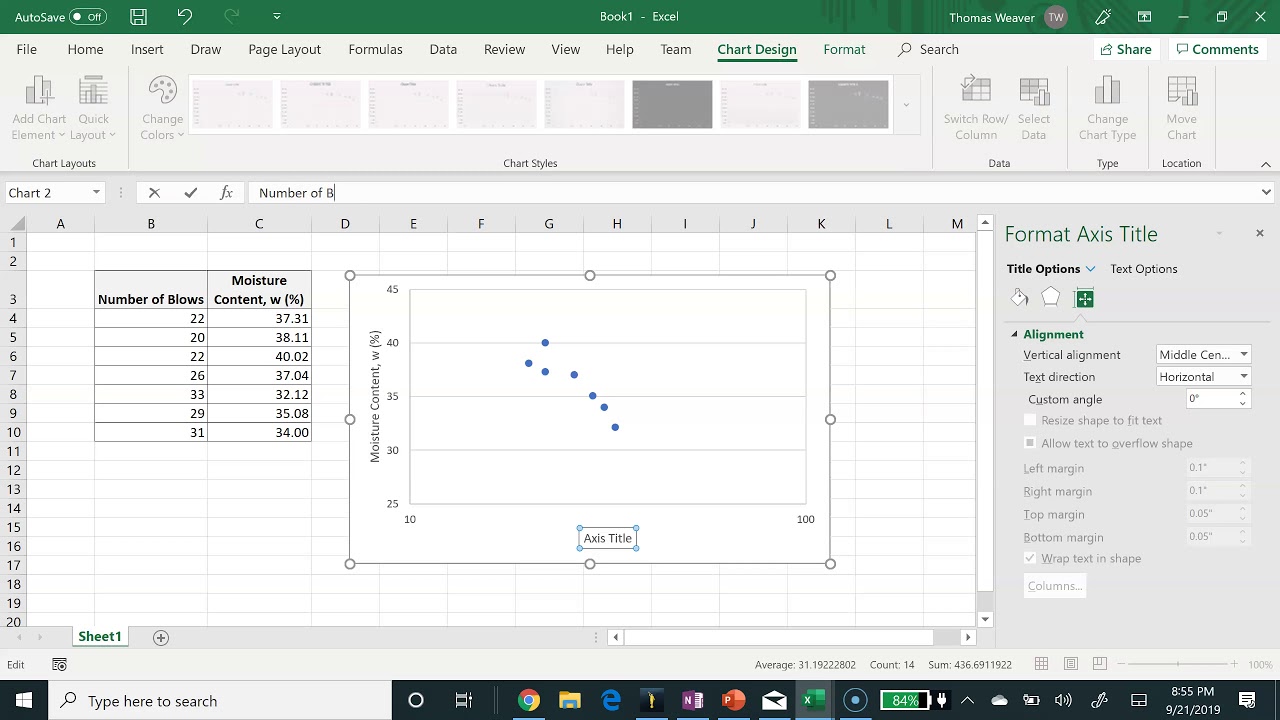
Plotting Liquid Limit Test Data
Автор: Thomas Weaver
Загружено: 2019-09-21
Просмотров: 30622
Описание: This video demonstrates how to plot liquid limit test results in Excel. In addition, a best fit line is added to the chart. The best fit equation is included in the chart, and the equation can be used to determine the liquid limit.
Не удается загрузить Youtube-плеер. Проверьте блокировку Youtube в вашей сети.
Повторяем попытку...
Повторяем попытку...
Доступные форматы для скачивания:
Скачать видео
-
Информация по загрузке: