Скачать
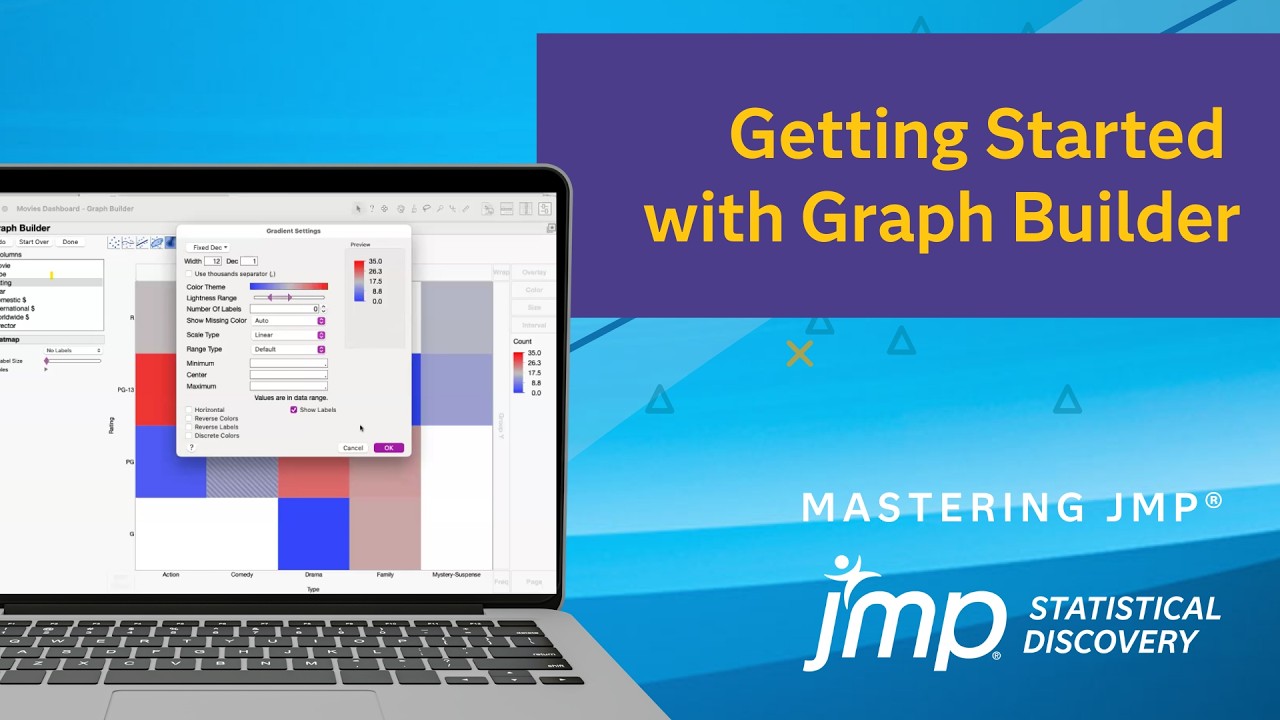
Getting Started with Graph Builder
Автор: JMP Statistical Discovery
Загружено: 2026-03-01
Просмотров: 102
Описание:
See one example of how to use JMP Graph Builder to interactively create visualizations to explore and describe your data. Drag and drop data to predefined zones to visually identify relationships between variables. Quickly create, undo, redo, and experiment with plots that link to your data, until you find the one you want.
See full video and materials: https://community.jmp.com/t5/Learn-JM...
Не удается загрузить Youtube-плеер. Проверьте блокировку Youtube в вашей сети.
Повторяем попытку...
Повторяем попытку...
Доступные форматы для скачивания:
Скачать видео
-
Информация по загрузке:


![Best of Deep House [2026] | Melodic House & Progressive Flow](https://imager.clipsaver.ru/Il-ZpBuC8tA/max.jpg)