Скачать
How to Calculate Measure of Central Tendency, Measure of Variability, and Draw the Polygon.
Автор: Astria Nur Wulandari
Загружено: 2026-02-13
Просмотров: 3
Описание:
Hello everyone 👋🏻
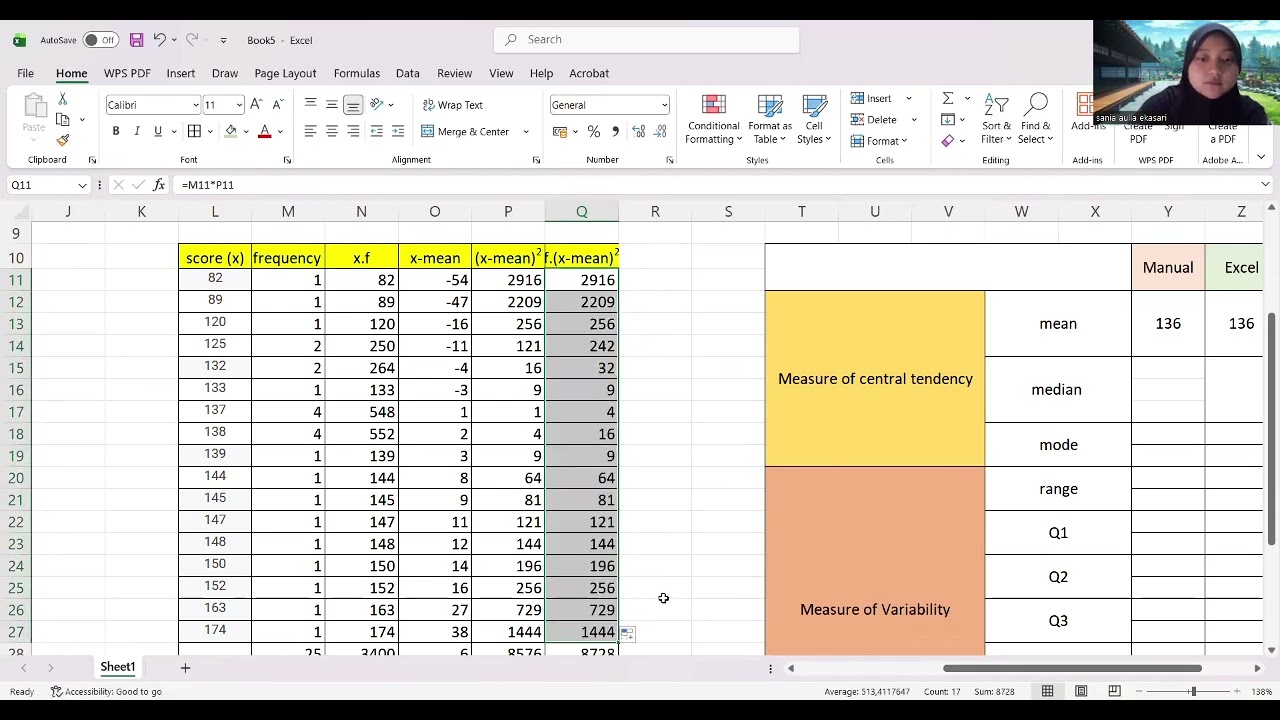
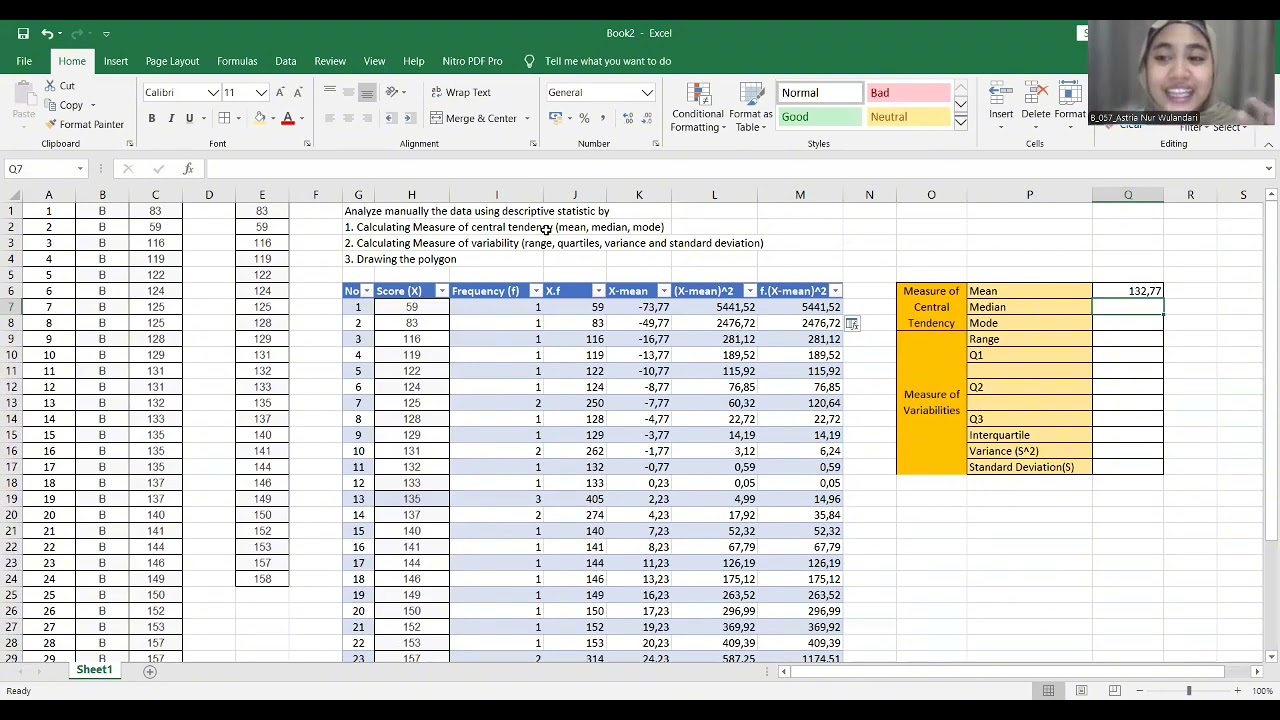
In this video, I provide a tutorial on statistics in Excel, specifically how to calculate measures of central tendency, measures of variability, and how to draw a frequency polygon.
There may be some mistakes in the video, and I sincerely hope you can kindly understand and forgive them.
This project was created to fulfill the assignment for the course Statistic in Educational Linguistics Research.
Lecture: Mrs. Nita Sari Narulita Dewi, M.Pd.
Name: Astria Nur Wulandari
Class: B
NPM: 242122111057
Thank you for watching, and I hope this video is helpful! 🌻
Не удается загрузить Youtube-плеер. Проверьте блокировку Youtube в вашей сети.
Повторяем попытку...
Повторяем попытку...
Доступные форматы для скачивания:
Скачать видео
-
Информация по загрузке: