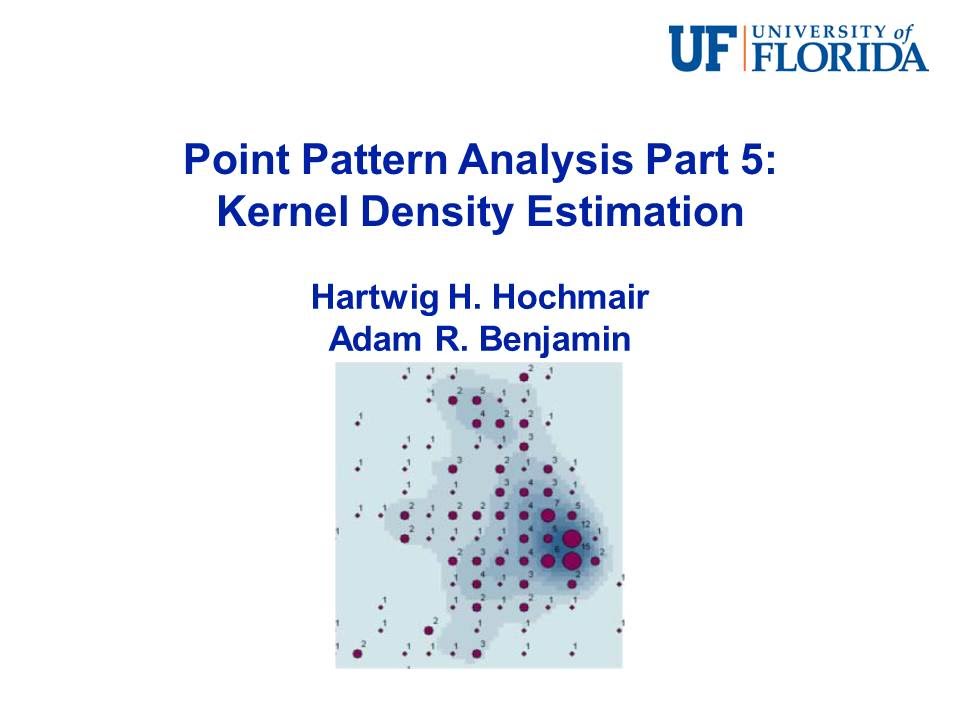
Point Pattern Analysis Part 5: Kernel Density Estimation
Автор: UF Geomatics - Fort Lauderdale
Загружено: 2016-01-29
Просмотров: 27066
Описание:
This presentation provides an introduction to kernel density estimation (KDE) techniques for visualizing event densities in maps.
This video presentation was created as part of a peer-reviewed educational series of Reusable Learning Objects (RLOs) on Spatial Analysis.
The full suite of presentations can be accessed at http://ecolearnit.ifas.ufl.edu/.
For more information on the state-wide and online Geomatics program at the University of Florida, please visit us at http://flrec.ifas.ufl.edu/geomatics/ (Fort Lauderdale campus) or http://sfrc.ifas.ufl.edu/geomatics/ (Gainesville campus).
Повторяем попытку...
Доступные форматы для скачивания:
Скачать видео
-
Информация по загрузке: