Three Line Break Charts Explained Plus A Simple Trading Strategy to Use Them
Автор: UKspreadbetting
Загружено: 2017-07-12
Просмотров: 65881
Описание:
✅ Trade with our Sponsor Broker: Trade Nation http://www.financial-spread-betting.c...
✅ Check our website: http://www.financial-spread-betting.com/
✅ Please like, subscribe & comment if you enjoyed - it helps a lot!
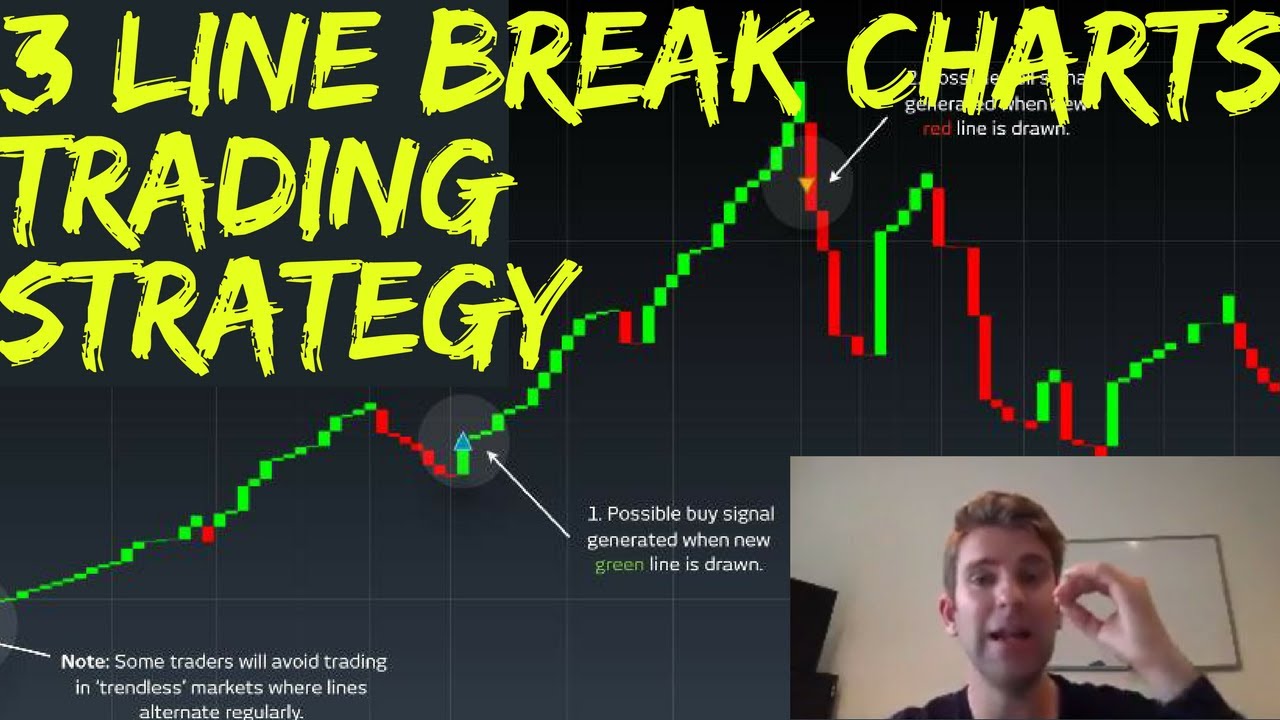
Three Line Break charts. http://www.financial-spread-betting.c... PLEASE LIKE AND SHARE THIS VIDEO SO WE CAN DO MORE! Three Line Break charts disregard time and only change when prices move a pre-determined value. As such these charts work in a similar way to Point & Figure charts.
The key difference between Three Line Break charts and regular candlestick charts is that time is of no relevance; price is the only thing you will see on your break. How does it work? A candle is formed when the prior high is broken. When we get a close above the prior high we will get a candle. The line break in this chart has been setup with the value of 3 (the most common). 3 is the number of recent lines that the close must break before a line is drawn in the opposite direction.
Line Break charts. The most popular (and probably the best for us to use) are the Three Line Break charts. These show a series of vertical green and red lines. Green lines denote rising prices while black lines denot falling prices. Prices keep moving in the same direction until a reversal is encountered. A reversal happens when the closing price exceeds the high or low of the prior two lines.
Повторяем попытку...
Доступные форматы для скачивания:
Скачать видео
-
Информация по загрузке: