Скачать
From Plain Excel to Pro-Level Dashboards: Power BI Tricks You Need to Know!
Автор: KnowledgeBank by obviEnce
Загружено: 2024-10-29
Просмотров: 709
Описание:
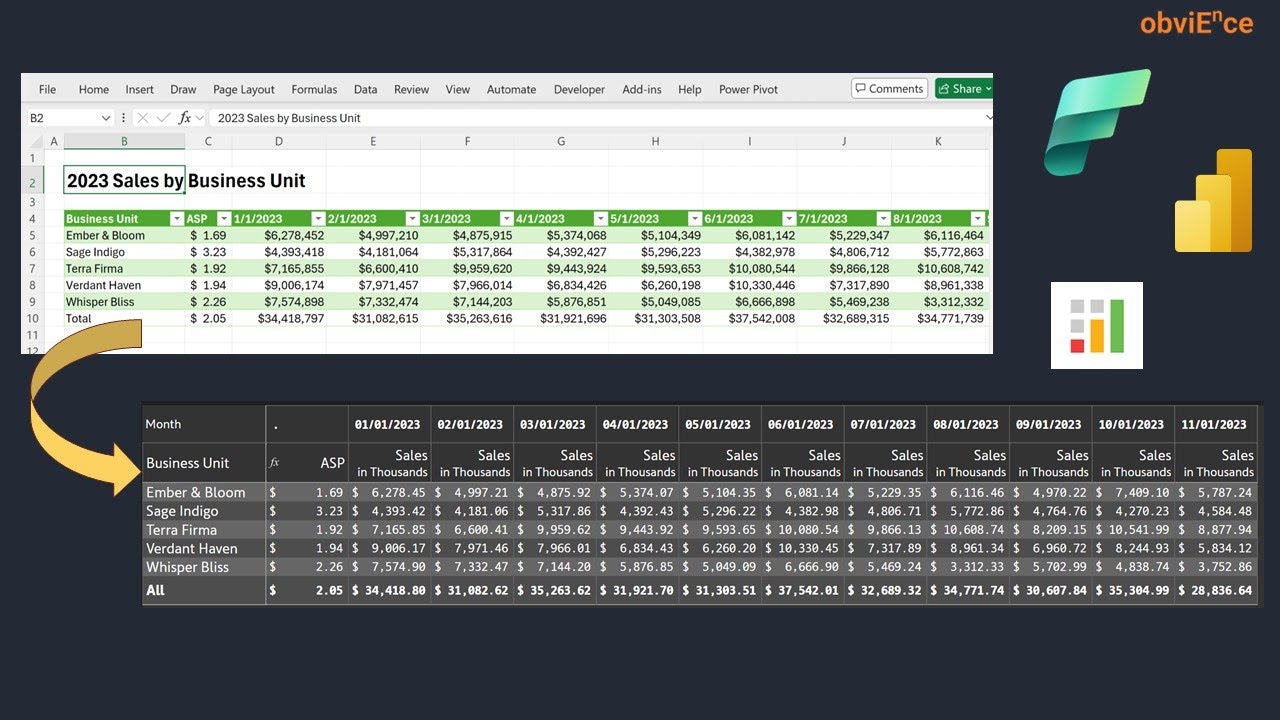
In this video, we explore how to convert excel reports, such as monthly sales and annual-level metrics like ASP, into intuitive, interactive Power BI reports.
You’ll learn three effective techniques:
Using matrix visuals for straightforward layouts.
Creating standalone header tables and smart measures for custom aggregation levels.
Leveraging the licensed Inforiver visual for high flexibility and professional formatting.
Не удается загрузить Youtube-плеер. Проверьте блокировку Youtube в вашей сети.
Повторяем попытку...
Повторяем попытку...
Доступные форматы для скачивания:
Скачать видео
-
Информация по загрузке: