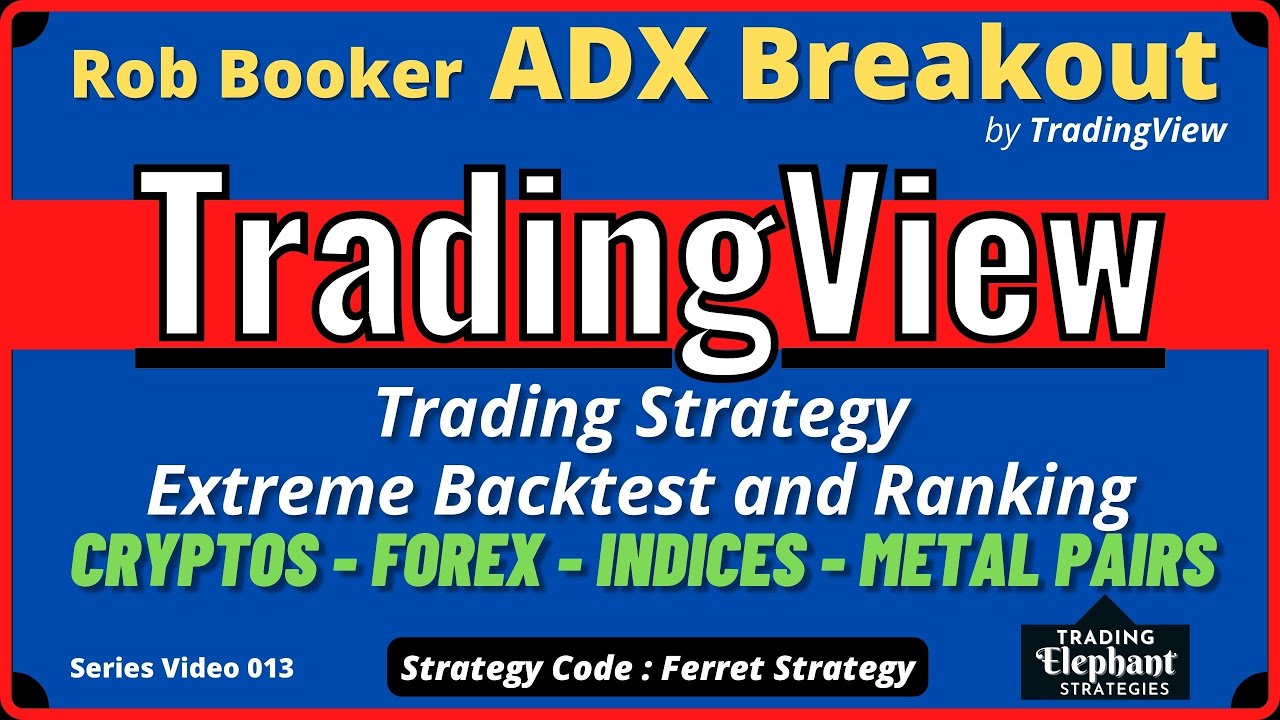
(013) max: 56.4% profit - Rob Booker ADX Breakout Strategy
Автор: Trading Elephant - NEW Videos after 1000 Subs
Загружено: 2022-05-24
Просмотров: 3449
Описание:
View or DOWNLOAD FREE the XLS of this (013) strategy :
https://docs.google.com/spreadsheets/...
Database and Ranking XLS of ALL the trading strategies : https://docs.google.com/spreadsheets/...
Hi traders,
today we have a strategy from TradingView again but with the help and reference of a cool trader, Rob Booker
Today we will deal with Rob Booker ADX Breakout.
Let me start by saying that Rob Booker looks like a cool guy.
You can go to his youtube channel by typing the name rob booker.
There you will see he provides education and fun stuff, like doing crazy things with indicators.
I really like these three videos regarding turning upside down the functionality of indicators.
That's the spirit if you want to create your own strategy path.
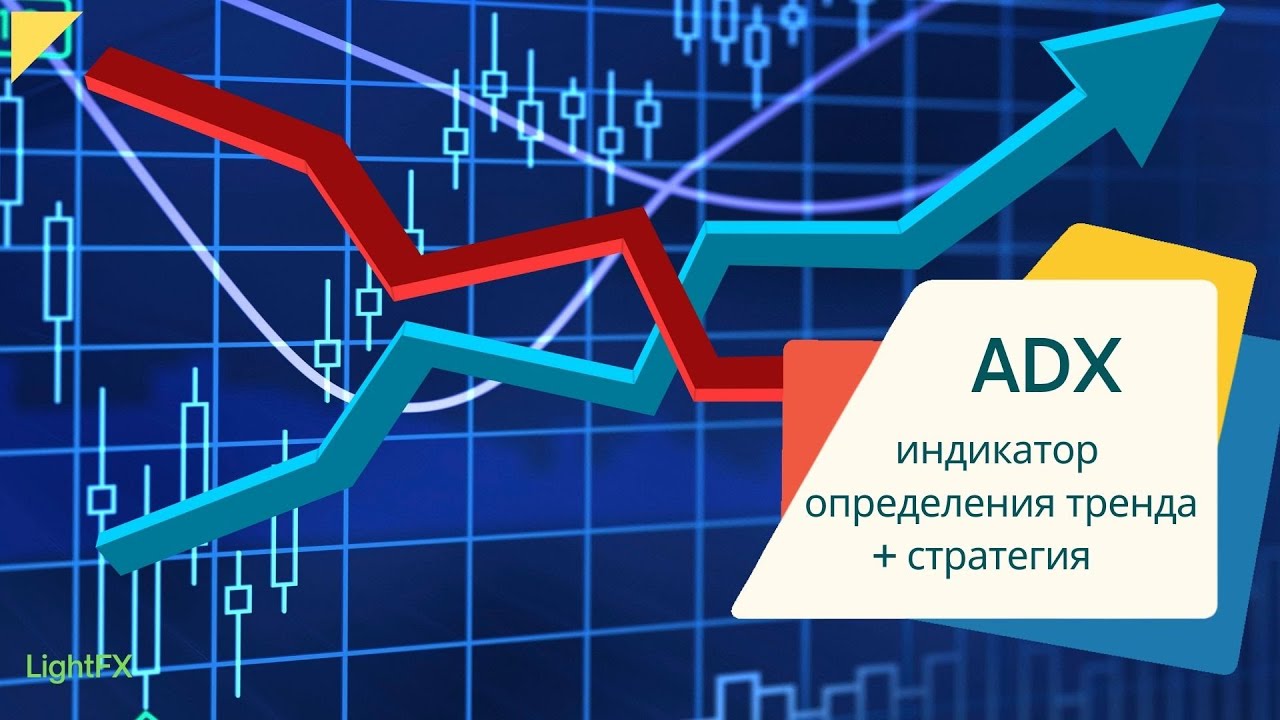
Let's go to the page of the strategy that is around the ADX indicator and some reference value that we act based on this in case there is a breakout detection.
On the detailed page we read :
Rob Booker’s Average Directional Index (ADX) Breakout is a trend strength indicator that affirms the belief that trading in the direction of a trend and continuing to follow its pull is more profitable for traders, while simultaneously reducing risk.
ADX was traditionally used and developed to determine a price’s trend strength. It is commonly known as a tool from the arsenal of Rob Booker, an experienced entrepreneur, and currency trader.
Calculations for the ADX Breakout indicator are based on a moving average of price range expansion over a specific period of time. By default, the setting rests at 14 bars, this however is not mandatory, as other periods are routinely used for analysis as well.
The ADX line is used to measure and determine the strength of a trend, and so the direction of this line and its interpretation are crucial in a trader’s analysis. As the ADX line rises, a trend increases in strength and price moves in the trend’s direction. Similarly, if the ADX line is falling, a trend decreases in strength and price then enters a period of consolidation or retracement.
Traditionally, the ADX is plotted on the chart as a single line that consists of values that range from 0 to 100. The line is non-directional, meaning that it always measures trend strength regardless of the position of a price’s trend (up or down). Essentially, ADX quantifies trend strength by presenting in both uptrends and downtrends of the line.
The values associated with the ADX line help traders determine the most profitable trades and where risk lies in the current trend. It is important to know how to quantify trend strength and distinguish between the varying values in order to understand the differences in trending vs. non-trending conditions. Let’s take a look at ADX values and what they mean for trend strength.
ADX Value:
0 to 25: Signifies an absence of weak trend
25 to 50: Signifies a strong trend
50 to 75: Signifies a very strong trend
75 to 100: Signifies an extremely strong trend
To delve into this a bit further, let’s assess the meaning of ADX if it is valued below 25. If the ADX line remains below 25 for more than 30 or so bars, the price then enters range conditions, making price patterns more distinguishable and visible to traders. Price will move up and down between resistance and support in order to determine selling and buying interest and may then eventually break out into a trend or pattern.
The way in which ADX peaks, ebs, and flows is also a signifier of its overall pattern and trend momentum. The line can clearly indicate to the trader when trend strength is strong versus when it is weak. When ADX peaks are pictured as higher, it points towards an increase in trend momentum. If ADX peaks are pictured as lower - you guessed it - it points towards a decrease in trend momentum. A trend of lower ADX peaks could be a warning for traders to watch prices and manage and assess risk before a trade gets out of hand. Similarly, whenever there is a sudden move that seems out of place or a change in trend character that goes against what you’ve seen before, this should be a clear sign to watch prices and assess risk.
FXCM,BYBIT,OANDA,AUDCAD,AUDCHF,AUDJPY,AUDNZD,AUDUSD,CADCHF,CADJPY,CHFJPY,EURAUD,EURCAD,EURCHF,EURGBP,EURJPY,EURNZD,EURUSD,GBPAUD,GBPCAD,GBPCHF,GBPJPY,GBPNZD,GBPUSD,NZDCAD,NZDCHF,NZDJPY,NZDUSD,USDCAD,USDCHF,USDJPY,AAVEUSDT,ADAUSDT,ALGOUSDT,APEUSDT,ATOMUSDT,AVAXUSDT,AXSUSDT,BCHUSDT,BITUSDT,BNBUSDT,BTCUSD,CROUSDT,CRVUSDT,DOGEUSDT,DOTUSDT,ENSUSDT,ETCUSDT,ETHUSD,FTMUSDT,GALAUSDT,GMTUSDT,HBARUSDT,JASMYUSDT,KNCUSDT,LINKUSDT,LOOKSUSDT,LTCUSDT,LUNAUSDT,MANAUSDT,MATICUSDT,NEARUSDT,OGNUSDT,ONEUSDT,RUNEUSDT,SANDUSDT,SHIB1000USDT,SLPUSDT,SOLUSDT,TRXUSDT,VETUSDT,WAVESUSDT,XMRUSDT,XRPUSDT,XTZUSDT,ZILUSDT,ZRXUSDT,AU200AUD,CN50USD,DE30EUR,EU50EUR,FR40EUR,HK33HKD,IN50USD,JP225USD,JP225YJPY,NAS100USD,NL25EUR,SG30SGD,SPX500USD,TWIXUSD,UK100GBP,US2000USD,US30USD,XAGUSD,XAUUSD
Повторяем попытку...
Доступные форматы для скачивания:
Скачать видео
-
Информация по загрузке:


![I Found a SECRET Method that Perfectly PREDICTS Reversals! [Nobody Knows This Strategy!]](https://imager.clipsaver.ru/l5VVp4xvqpA/max.jpg)