ycliper

Популярное

Музыка Кино и Анимация Автомобили Животные Спорт Путешествия Игры Юмор

Интересные видео

2025 Сериалы Трейлеры Новости Как сделать Видеоуроки Diy своими руками

Топ запросов

смотреть а4 schoolboy runaway турецкий сериал смотреть мультфильмы эдисон
Скачать

Cumulative Flow Diagram Tutorial

Автор: John Meedzan

Загружено: 2018-12-14

Просмотров: 23673

Описание: 
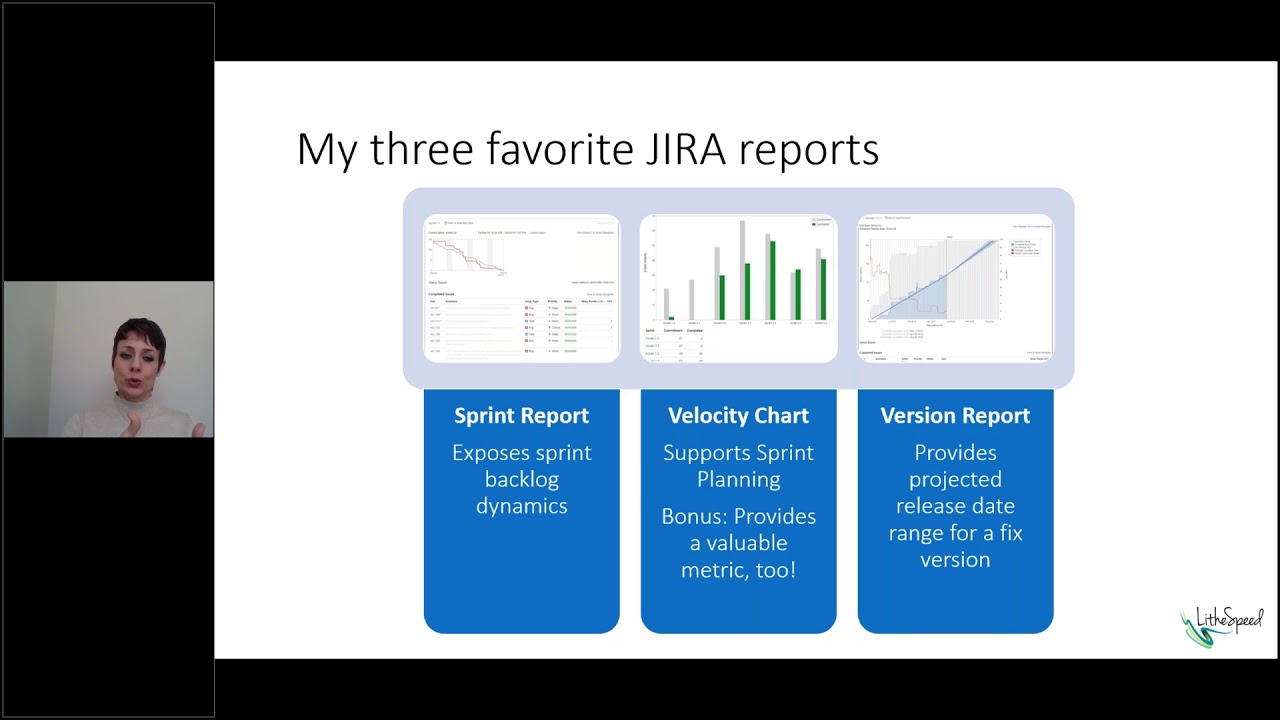
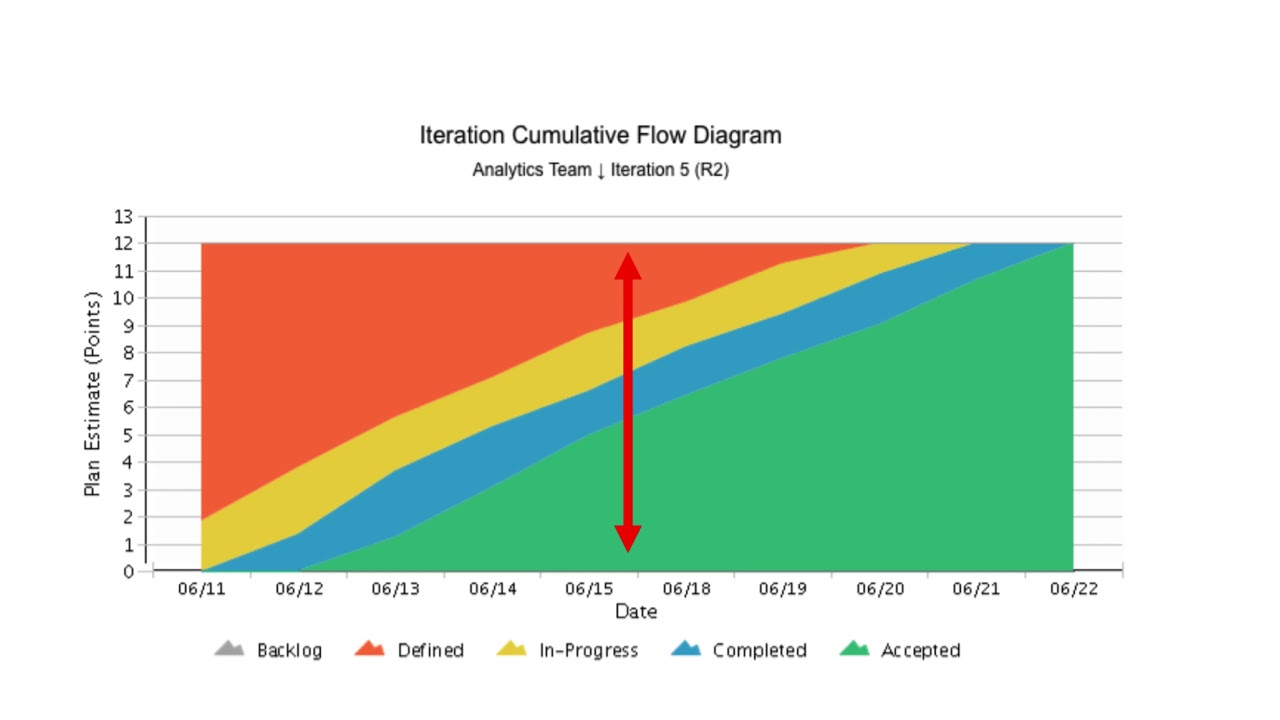
Understanding the value of the Cumulative Flow Diagram, or CFD, to support team maturity and delivery predictability

The Cumulative Flow Diagram (CFD) is an area graph that depicts the quantity of work in a given stage for a specified timeframe (e.g. an iteration or a program increment), the duration that the work remains in a stage, and the completion of the work between the stages. The CFD exposes lots of critical flow information and enables better decision making.

Не удается загрузить Youtube-плеер. Проверьте блокировку Youtube в вашей сети.
Повторяем попытку...
Cumulative Flow Diagram Tutorial

Поделиться в:

Доступные форматы для скачивания:

Скачать видео

  • Информация по загрузке:

Скачать аудио

Похожие видео

Using Cumulative Flow Diagrams

Using Cumulative Flow Diagrams

Introduction to Cumulative Flow Diagrams

Introduction to Cumulative Flow Diagrams

Sprint Burndown Chart – Что это и как использовать | DBlinov.com, 2022

Sprint Burndown Chart – Что это и как использовать | DBlinov.com, 2022

Cumulative Flow Diagram (CFD) – 7 Case examples

Cumulative Flow Diagram (CFD) – 7 Case examples

Agile Estimating and Planning

Agile Estimating and Planning

Interpreting Cumulative Flow Diagrams

Interpreting Cumulative Flow Diagrams

Why

Why "Doing" Agile is the Wrong Approach (Agile Mindset)

Smooth Jazz Chill Out Lounge with Female Vocals | Soulful Romantic Jazz Songs

Smooth Jazz Chill Out Lounge with Female Vocals | Soulful Romantic Jazz Songs

JIRA Dashboards and Metrics

JIRA Dashboards and Metrics

Cumulative Flow Diagram

Cumulative Flow Diagram

Measuring Success in Agile Teams

Measuring Success in Agile Teams

Top 10 Agile Metrics

Top 10 Agile Metrics

Объяснение кумулятивных диаграмм потоков: визуализация гибких рабочих процессов для начинающих

Объяснение кумулятивных диаграмм потоков: визуализация гибких рабочих процессов для начинающих

Hans Zimmer EPIC MUSIC - Best of 1 Hour

Hans Zimmer EPIC MUSIC - Best of 1 Hour

Sprint Burn-down Chart

Sprint Burn-down Chart

Takt Time, Cycle Time, Lead Time

Takt Time, Cycle Time, Lead Time

Kanban metrics explained | Daniel Vacanti about Forecasting Projects

Kanban metrics explained | Daniel Vacanti about Forecasting Projects

LLKD15 - Kanban Metrics in Practice - Mattia Battiston

LLKD15 - Kanban Metrics in Practice - Mattia Battiston

Bye Bye Velocity! Kanban metrics as an alternative to story points & velocity.

Bye Bye Velocity! Kanban metrics as an alternative to story points & velocity.

Визуализация скрытого пространства: PCA, t-SNE, UMAP | Глубокое обучение с анимацией

Визуализация скрытого пространства: PCA, t-SNE, UMAP | Глубокое обучение с анимацией

© 2025 ycliper. Все права защищены.


  • Контакты
  • О нас
  • Политика конфиденциальности


Контакты для правообладателей: [email protected]