Identifying Percentiles using the t-Distribution Table | t-distribution | Statistics and Probability
Автор: Prof D
Загружено: 2021-06-06
Просмотров: 23172
Описание:
Statistics and Probability
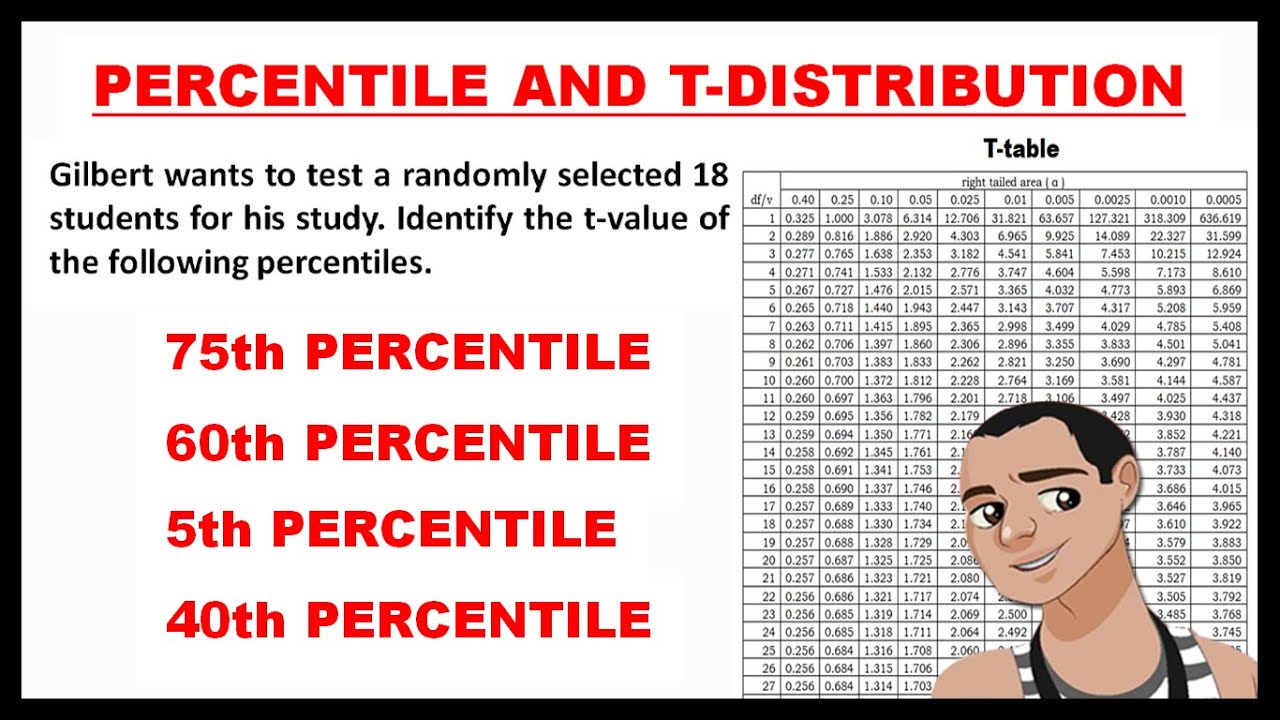
Identifying Percentiles using the t-Distribution Table | t-distribution
The T distribution, also known as the Student's t-distribution, is a type of probability distribution that is similar to the normal distribution with its bell shape but has heavier tails. T distributions have a greater chance for extreme values than normal distributions, hence the fatter tails.
General Mathematics Playlist
• Solving Rational Equations | General Mathe...
Statistics and Probability Playlist
• EXPLORING RANDOM VARIABLES | DISCRETE AND ...
Pre-Calculus Playlist
• INTRODUCTION TO CONIC SECTIONS | PROF D
Calculus Playlist
• Finding the limit of a function using tabl...
For more updates, you can also follow my Facebook Page:
/ mathprofd
Join this channel to get access to perks:
/ @profd
For Business and Collaboration:
[email protected]
Please don't forget to like, share, and subscribe!
/ profd
Thank You Guys!
#ProfD
Повторяем попытку...
Доступные форматы для скачивания:
Скачать видео
-
Информация по загрузке: