How to make Urban Sprawl Map 1990 - 2023 || Urban Growth || Urban Sprawl Map || Google Earth Engine
Автор: GIS Analysis
Загружено: 2023-11-11
Просмотров: 7806
Описание:
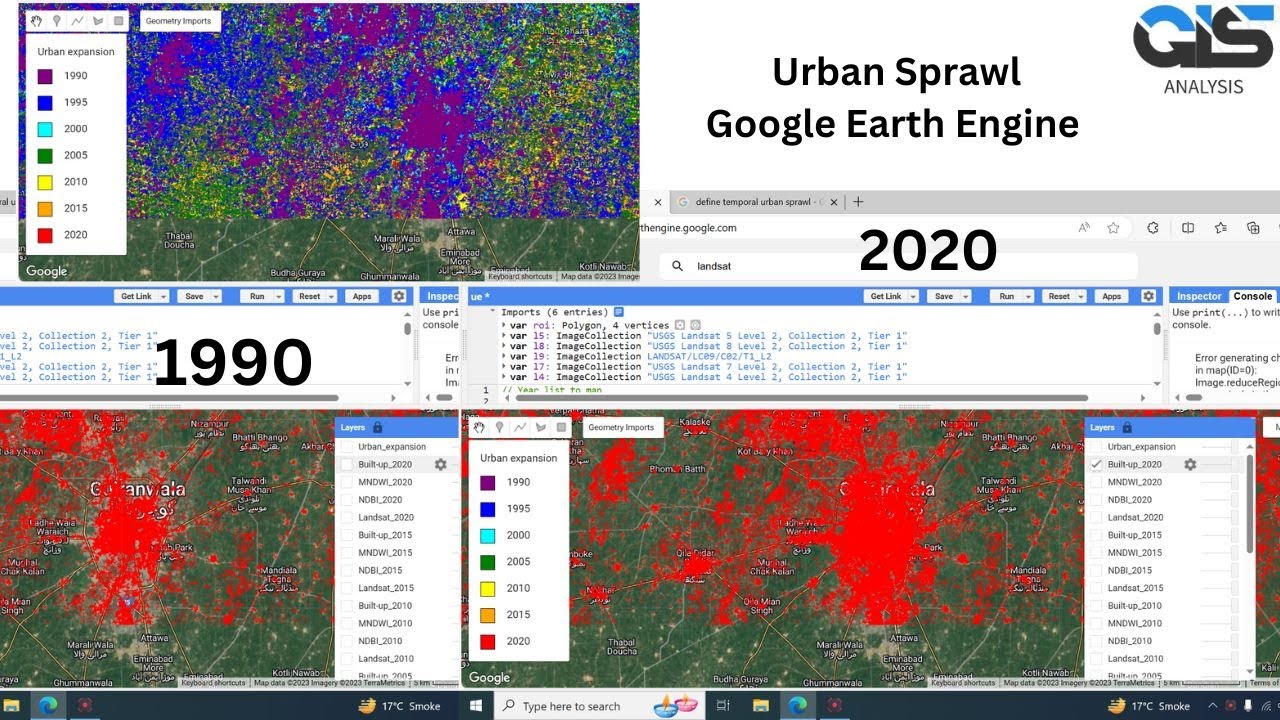
This code is written in Google Earth Engine (GEE) JavaScript API and is used for analyzing urban
expansion over a series of years using Landsat satellite imagery. Let's break down the code and
understand its functionality:
Variables and Functions:
1. *Year List:*
```javascript
var yearList = [1990, 1995, 2000, 2005, 2010, 2015, 2020];
```
This array contains the years for which the analysis will be performed.
2. *Filtering Function:*
```javascript
function filterCol(col, roi, date) {
return col.filterDate(date[0], date[1]).filterBounds(roi);
}
```
This function filters a given image collection (`col`) based on a date range (`date`) and a region of
interest (`roi`).
3. *Cloud Masking Functions:*
Two functions, `cloudMaskTm` and `cloudMaskOli`, are defined for cloud masking in Landsat images.
4. *Composite Functions:*
Two functions, `landsat457` and `landsat89`, are defined to create composite images for Landsat 4, 5,
and 7 (for years before 2014) and Landsat 8 and 9 (for years from 2014 onward), respectively.
5. *Generate Image per Year Function:*
```javascript
var builtCol = ee.ImageCollection(yearList.map(function (year) {
// ...
}));
```
This function generates a collection of images for each year using Landsat data, applies cloud masking,
and calculates indices such as NDBI and MNDWI. It also adds these layers to the GEE map.
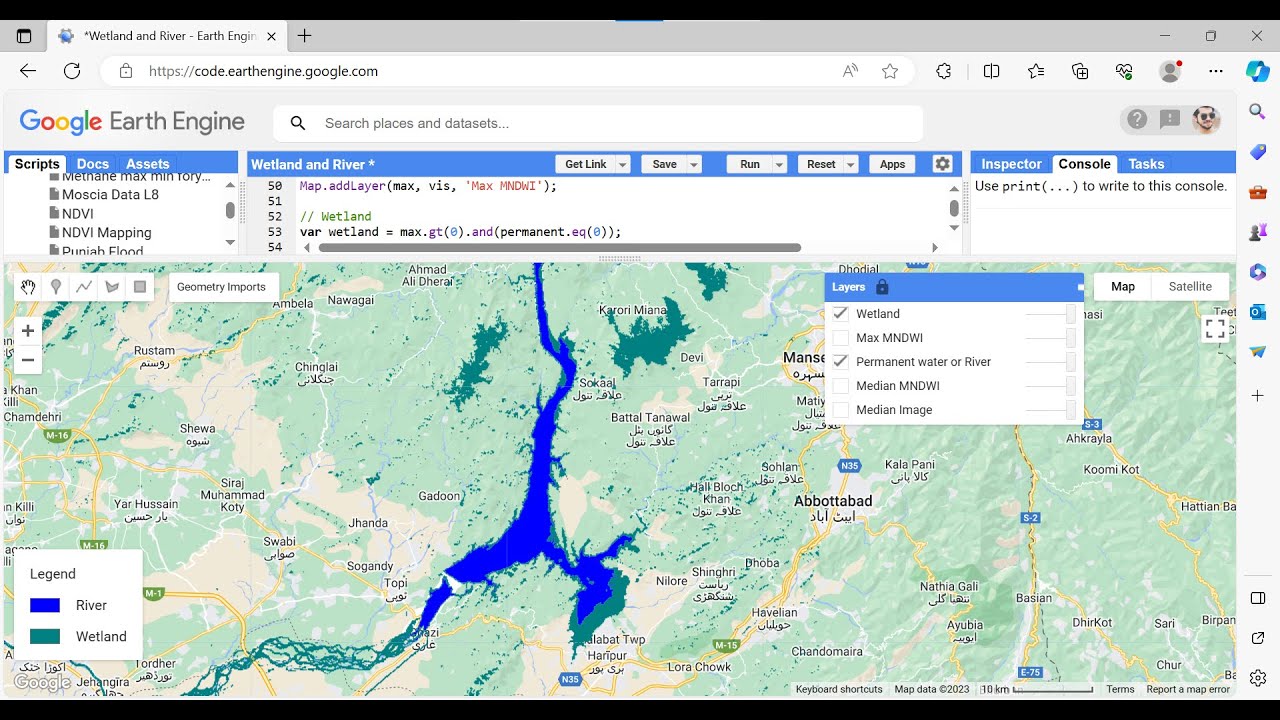
Image Generation and Visualization:
The code then goes through each year in `yearList`, decides which Landsat collection to use based on the
year, generates a composite image, calculates indices, and visualizes the results on the map.
Urban Expansion and Visualization:
```javascript
var urbanExpansion = builtCol.select('built').min().set(dict);
Map.addLayer(urbanExpansion, {}, 'Urban_expansion');
```
This section creates an image representing the minimum built-up class value for each pixel over the
years. The results are visualized on the map as "Urban Expansion."
Legend and Visualization:
```javascript
var legend = ui.Panel([ui.Label('Urban expansion')], ui.Panel.Layout.flow('vertical'), { position: 'bottomleft' });
yearList.map(function(year, index){
// ...
});
Map.add(legend);
```
A legend is created and added to the map, showing the color-coded classes for each year of urban
expansion.
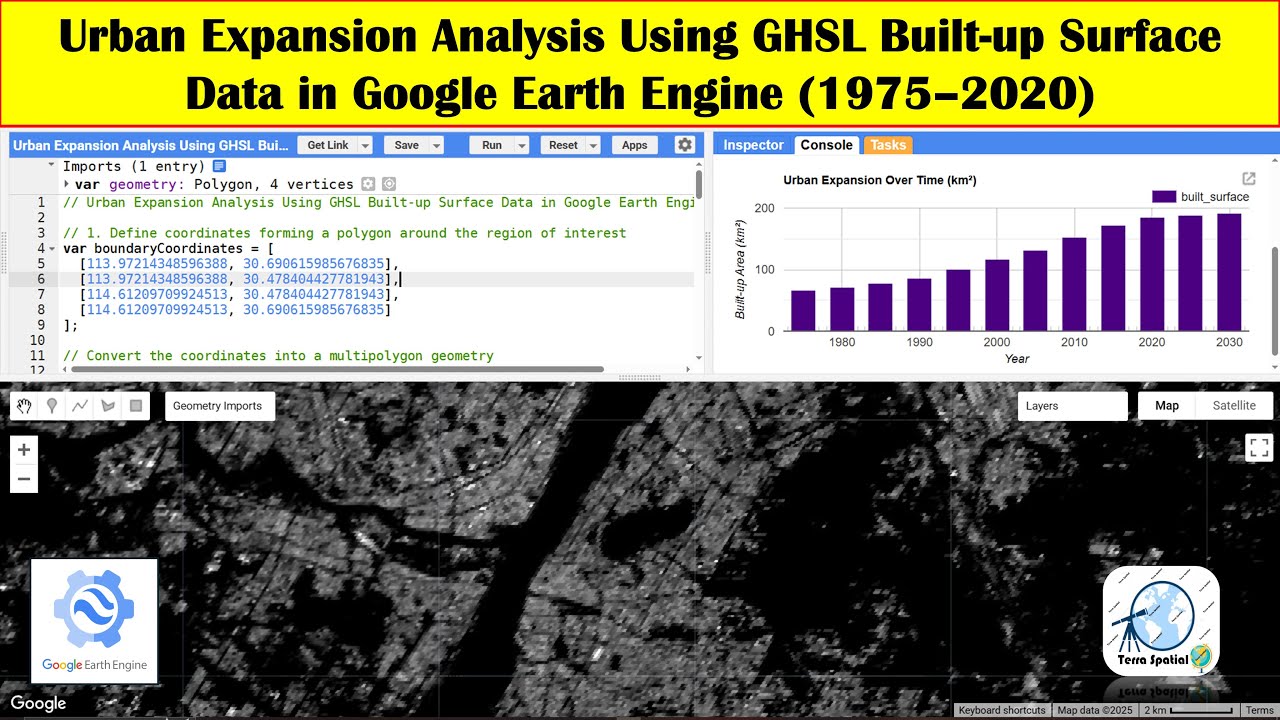
Area Chart:
```javascript
var areaChart = ui.Chart.image.series(builtCol.select('area'), roi, ee.Reducer.sum(), 30, 'year')
.setChartType('AreaChart')
.setOptions({
title: 'Urban area (Ha)',
hAxis: { title: 'Year' },
vAxis: { title: 'Area (Ha)' }
});
print(areaChart);
```
This section generates and prints an area chart showing the change in urban area over the specified
years.
Summary:
The code performs a comprehensive analysis of urban expansion over a series of years using Landsat
satellite imagery. It involves filtering, cloud masking, index calculation, visualization, and charting to
provide a detailed understanding of urban growth over time.
Повторяем попытку...
Доступные форматы для скачивания:
Скачать видео
-
Информация по загрузке: