Smart Analysis in Power BI | Inforiver
Автор: Inforiver
Загружено: 2023-05-29
Просмотров: 644
Описание:
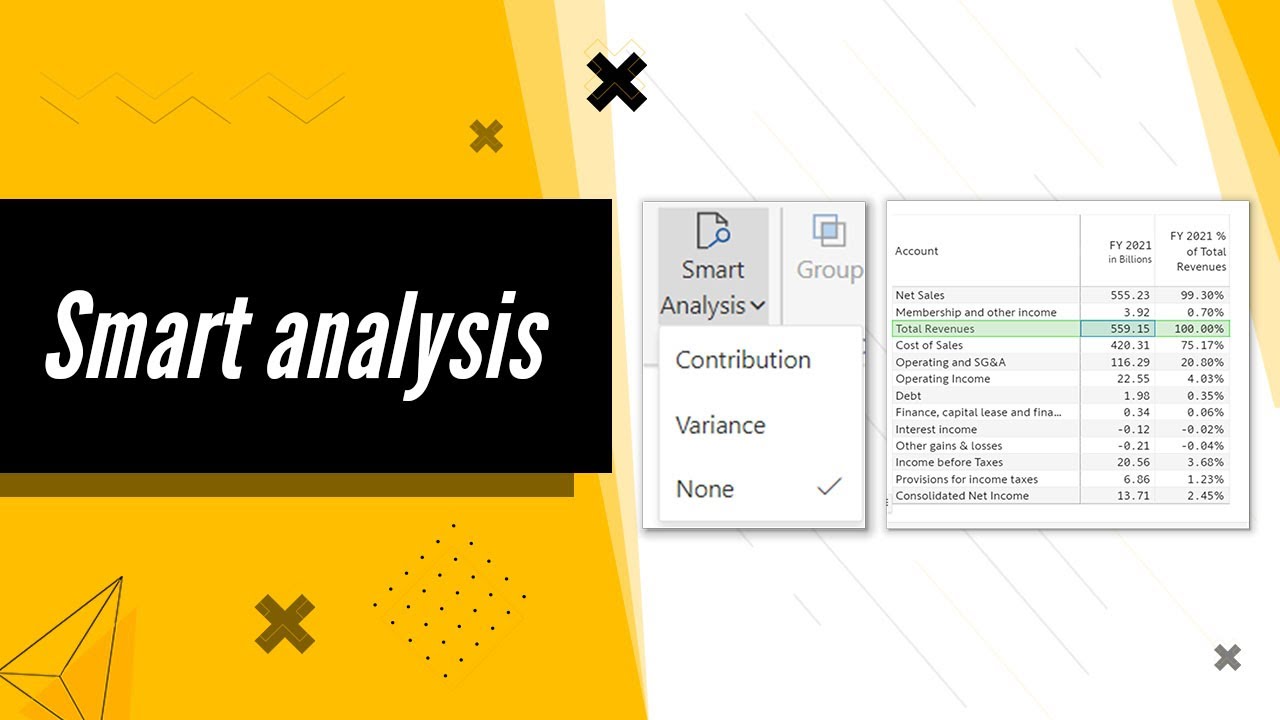
Inforiver provides quick smart analysis options to meet your specific needs. In this video, we'll show you how to perform two advanced analyses that would normally require using DAX.
(a) Contribution/vertical analysis: Easily determine the contribution of each value in a column to a chosen benchmark cell.
(b) Variance analysis: Quickly calculate the variance of each value in a column to a chosen benchmark cell.
Inforiver brings advanced Power BI visuals, financial and variance analysis, and a no-code experience to Power BI for a seamless dashboard building experience. Get a 360-degree view of performance across multiple time periods and categories with automated variances, trend lines, and reference bands. Leverage features requested in Power BI idea place and community forums. Inforiver also enables easier comparison with external industry benchmarks. Automate your Excel processes with formula engine & calculations, manual data entry, forecasting, writeback, audit trail, commenting & collaboration. Inforiver delivers unique capabilities available in other BI & visualization software (such as Tableau, Spotfire, Qlik, Cognos and SAP BusinessObjects) but not in Power BI, so that organizations can successfully migrate and consolidate their BI assets with Power BI.
To receive regular updates visit:
Website: https://inforiver.com/
LinkedIn: / info. .
Twitter: / inforiverbi
Facebook: / inforiverana. .
Community : https://community.inforiver.com/
#analytics
Повторяем попытку...
Доступные форматы для скачивания:
Скачать видео
-
Информация по загрузке: