Excel Charts - Waterfall Chart/Flying Brick Chart/ Mario Chart || Easy to make Charts ||
Автор: Excel - Curiosity for learning
Загружено: 2018-12-23
Просмотров: 1803
Описание:
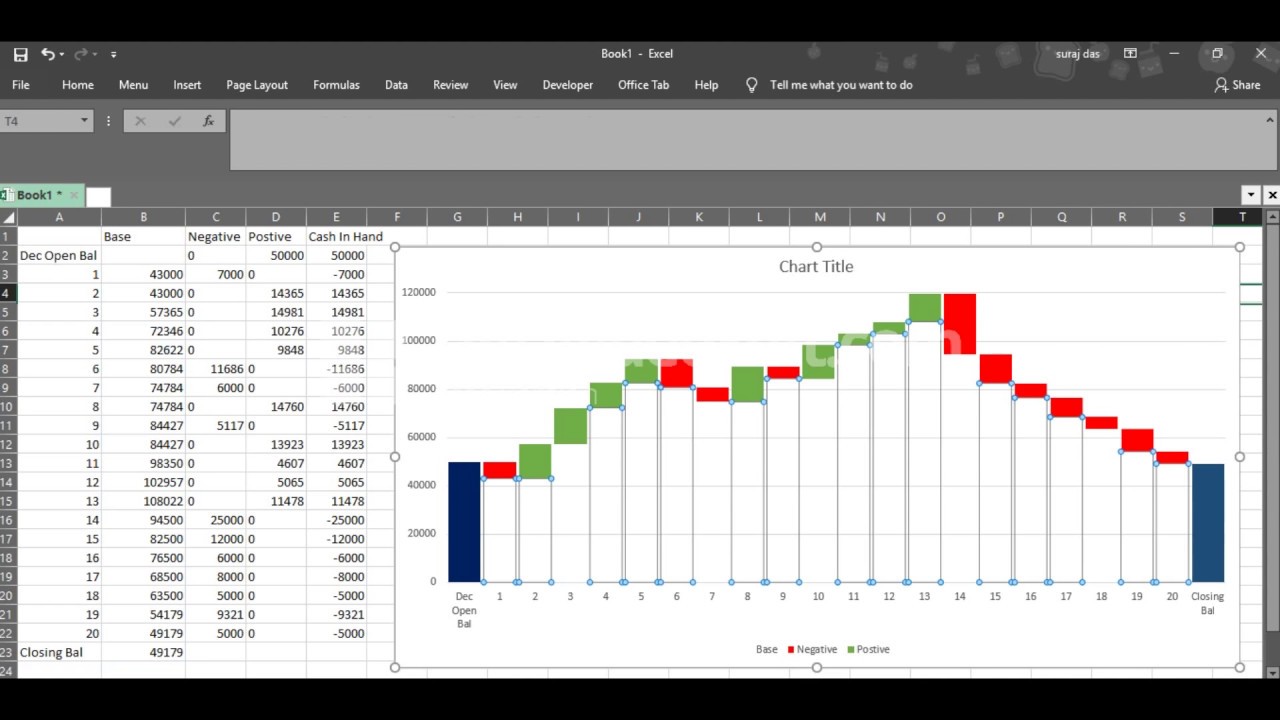
A waterfall chart is a form of data visualization that helps in understanding the cumulative effect of sequentially introduced positive or negative values. These intermediate values can either be time based or category based. The waterfall chart is also known as a flying bricks chart or Mario chart due to the apparent suspension of columns (bricks) in mid-air. Often in finance, it will be referred to as a bridge
----------------------------------------
Please subscribe the channel for more studies and learning about excel
You can also send me an email on [email protected]
*** check curiosity spelling
#Excel #ExcelTutorial #ExcelChart #ExcelLearning #
Повторяем попытку...
Доступные форматы для скачивания:
Скачать видео
-
Информация по загрузке:


