How to Do a Dot Plot for Statistics : Statistics 101
Автор: eHowEducation
Загружено: 2013-02-02
Просмотров: 45319
Описание:
Subscribe Now:
http://www.youtube.com/subscription_c...
Watch More:
/ ehoweducation
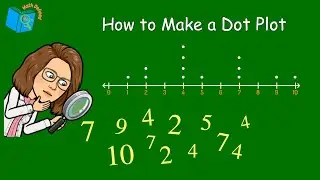
A dot plot is a really great way to compare patterns within categories and groups in statistics. Learn how to do a dot plot for statistics with help from a mathematics educator in this free video clip.
Expert: Jimmy Chang
Filmmaker: Christopher Rokosz
Series Description: When working with statistics, you're going to want to familiarize yourself with a variety of important formulas and concepts. Get tips on working with statistics problems with help from a mathematics educator in this free video series.
Повторяем попытку...

Доступные форматы для скачивания:
Скачать видео
-
Информация по загрузке:


![Understand Box Plots in Statistics (Box-and-Whisker Plots) - [6-8-23]](https://image.4k-video.ru/id-video/cklvFT8dR64)


