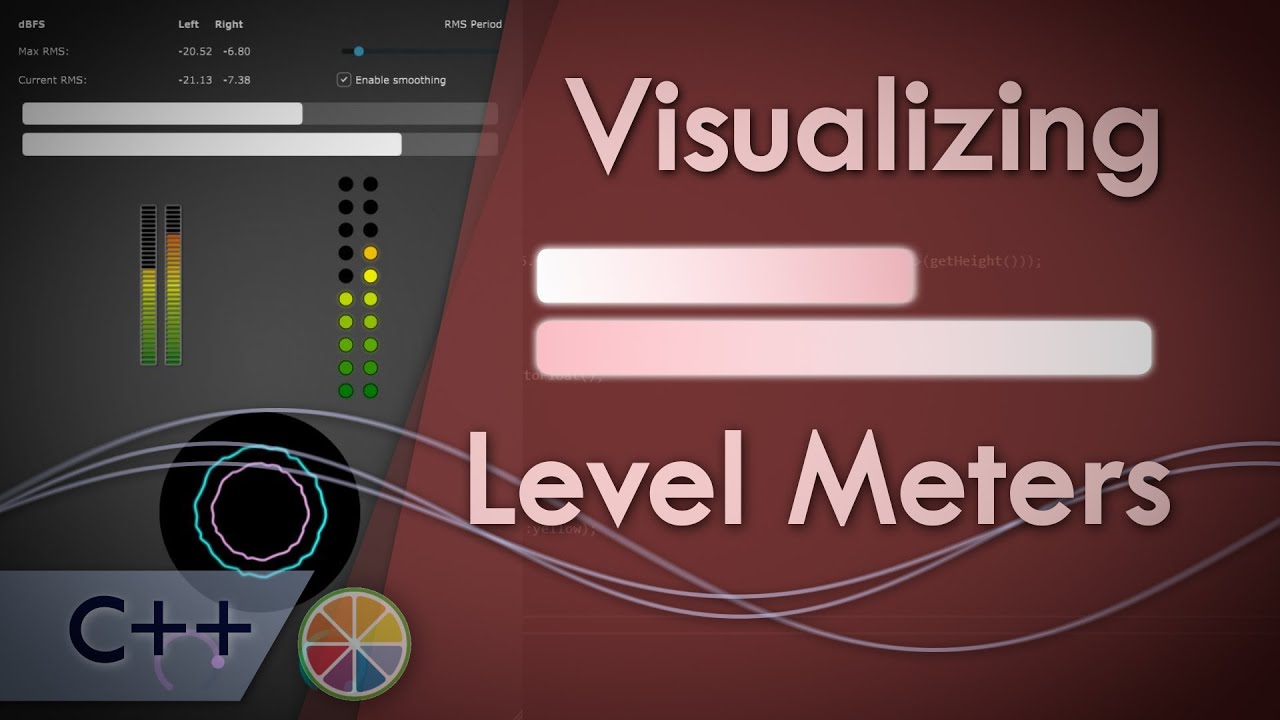
Drawing Level Meters - Visualizations with JUCE
Автор: Akash Murthy
Загружено: 2021-09-13
Просмотров: 24170
Описание:
In this video, we'll learn how to draw and visualize a level meter in JUCE. We'll get a primer on RMS calculations, and how RMS levels of an audio signal can be used as the data sources for drawing graphical metering components.
0:00 Introduction
2:46 Theory and explanation
10:42 Setting up the project
13:02 Meter 1
24:14 Smoothing the level
29:27 Meter 2
40:46 Meter 3
To follow along with this coding tutorial, you'll need a C++ compiler installer, an IDE of your choice (Visual Studio, Xcode) and JUCE framework installed, along with Projucer. I'll have a starter series on how to get started with JUCE soon, but you can find plenty of tutorials on their website and on YouTube.
An introduction to JUCE and plugin development: (TBD)
Find the source code here: https://github.com/Thrifleganger/leve...
If you've got any questions, suggestions or recommendations, type them out here, or send me a message on any of my social channels mentioned below.
A lot of time was spent on creating this series, and I plan to do more. So please consider subscribing if you wish to be notified about more releases in the future. And if you feel generous: / akashmurthy
Check out my music here: https://farfetchd-official.bandcamp.com/
Give me a shout here:
Facebook - / akash.murthy.319
Instagram - / thrifleganger
Повторяем попытку...
Доступные форматы для скачивания:
Скачать видео
-
Информация по загрузке:


![How I Set Up Every Audio Plugin C++ Project with JUCE, CMake, and Unit Tests [TEMPLATE REPO]](https://imager.clipsaver.ru/Uq7Hwt18s3s/max.jpg)

![Lowpass and Highpass Filter Plugin with JUCE C++ Framework | Tutorial for Beginners [AudioFX #010]](https://imager.clipsaver.ru/xJCt0MVZZ7Q/max.jpg)