How to Create a Jitter Plot in Power BI | Tutorial | Excel File + Power Bi Document in Description
Автор: Albert Data Analyst
Загружено: 2023-12-07
Просмотров: 772
Описание:
Download Data:
https://drive.google.com/drive/folders/1sU...
==================================
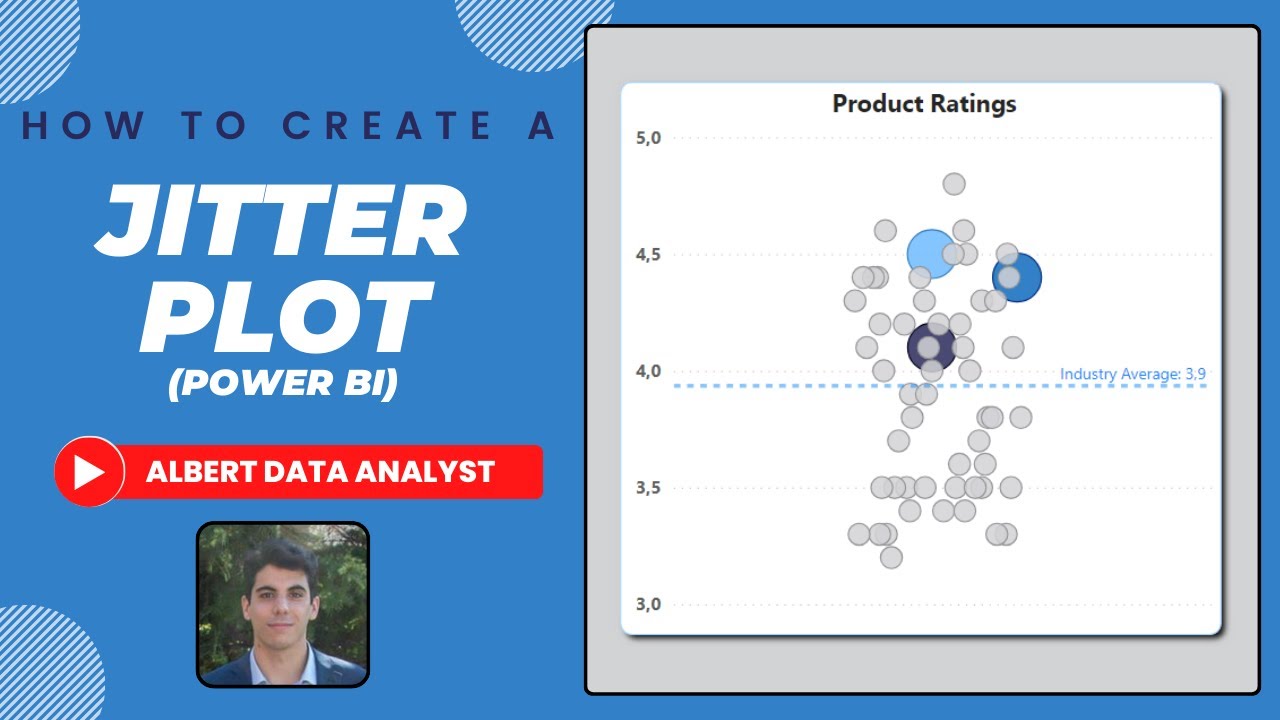
In this tutorial, you will learn how to create a Jitter plot in Power BI to compare the Amazon rating scores across all the products on the first page of the search results for a certain keyword.
Why Jitter Plot?
A jitter plot is effective for visualizing individual data points in a categorical context, preventing overlap, aiding in the identification of clusters or trends, and effectively portraying the distribution of data.
==================================
power bi tutorial, power bi desktop tutorial, power bi tutorial for beginners, power bi desktop, power bi dashboard, power bi training, power bi demo, power bi for beginners, power bi dashboard tutorial, power bi tutorial for beginners excel, power bi, tutorial, desktop, dashboard, excel, microsoft excel, power bi vs tableau, tableau vs power bi, mspowerbi, Power BI Pro, PowerBIPro, Microsoft PowerBI, Microsoft Power BI, PowerBI, Power BI, PowerBI Tutorial, Power BI Tutorial, PowerBI Dashboard
Повторяем попытку...
Доступные форматы для скачивания:
Скачать видео
-
Информация по загрузке:


![How to Make A Horizontal Jitter Plot in Excel🧑💻 [EXCEL TIPS! 📊]](https://imager.clipsaver.ru/3nHqRqSn-Y4/max.jpg)