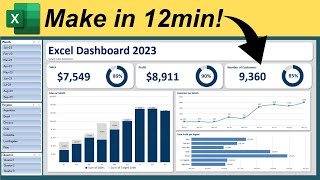
Effortlessly Create Excel Dashboards with Slicers, Pivot Tables, and Charts
Автор: Lighthouse Analytix
Загружено: 2021-05-26
Просмотров: 702
Описание:
Learn the secrets that will allow you to build an interactive & dynamic Excel Dashboard FAST, in less than 5 minutes.
If you are an aspiring analyst, then you need to know how to create an interactive excel dashboard, so that you are able to provide information and insights with speed and accuracy.
What is Interactive Excel Dashboard?
Interactive Excel Dashboard is a combination of multiple charts and or tables, which can change dynamically as users are selecting different inputs via filters or slicers.
Interactive Excel Dashboard is the opposite of traditional static excel report which remain constant and does not allow a user to change any inputs or parameters.
How to create an Interactive Excel Dashboard in less than 5 minutes?
Interactive Excel Dashboard is surprisingly easy to make provided you know the 5 secrets, which will be explained in details in the videos.
1. Data Structure
2. Charts from pivot table
3. Slicers
4. Dashboard Page
5. Connecting slicers to ALL charts
Timestamps:
0:00 Introduction
0:11 What is an Interactive Dashboard
2:47 What are the 5 Secrets?
4:30 Let's get the timer started & do this together
9:03 Epilogue & what's coming up next week
Hope you enjoy this video. Let me know if you want to learn more about this topic by liking this video or by leaving your comments.
Cheers,
Isabella Susilowati
#LighthouseAnalytix
#MsExcel
#Dynamic
#Interactive
#Dashboard
Music: https://www.bensound.com/royalty-free...
LA07
Повторяем попытку...

Доступные форматы для скачивания:
Скачать видео
-
Информация по загрузке: