Unveiling Kolleru Lake’s 40-Year Environmental Makeover with Satellite Indices
Автор: Data Driven Info
Загружено: 2025-11-21
Просмотров: 45
Описание:
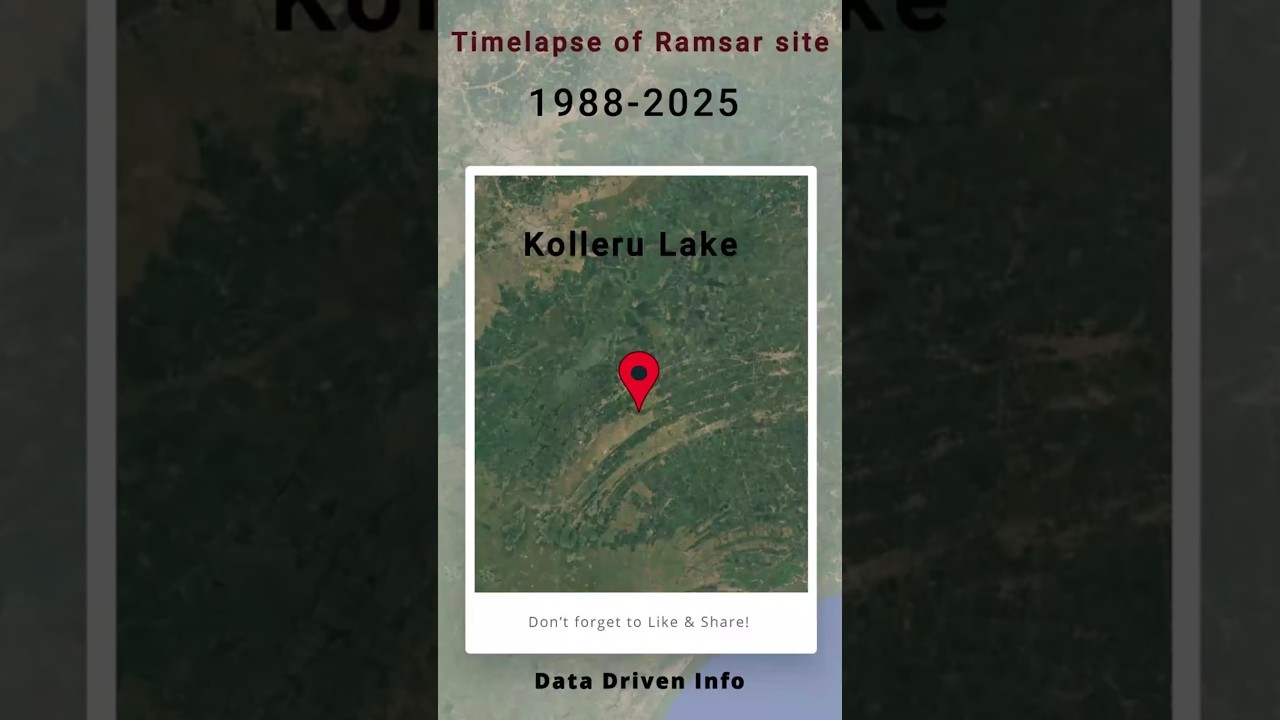
Data Driven Info takes you on a dramatic journey through four decades of change at Kolleru Lake, India, using Landsat satellite imagery and advanced remote sensing indices. Kolleru Lake is India’s largest freshwater wetland, but it has been heavily impacted by human activity (notably aquaculture and farming) and climate factors. Over the past 40 years, massive fishpond encroachments and land-use changes have degraded the lake’s water quality and wetlands. In this video we visualize those changes by computing multispectral indices for each time period. We use Landsat archives to process and map the lake from the 1980s to today.
Each index highlights a different feature: Natural-color (RGB) images show the lake as our eyes would see it. Color-Infrared (CIR) false-color composites use the near-infrared band so vegetation appears bright red, making it easy to spot healthy plant cover. Specialized “False Color” views (vegetation and urban) further isolate features – for example, urban or bare-soil areas stand out when using SWIR vs. NIR or other band combinations. We also compute classic remote-sensing indices: NDVI (Normalized Difference Vegetation Index) measures vegetation health by comparing near-infrared and red reflectance, NDWI (water index) highlights open water by using green vs. NIR bands, MNDWI (Modified NDWI) replaces NIR with shortwave IR to better isolate water in urban or mixed areas, and NDBI (Built-up Index) identifies urbanized or pond areas using SWIR vs. NIR bands. By overlaying these indices on the Landsat images, we reveal how vegetation cover, open water, and built-up ponds have changed at Kolleru Lake over time.
This detailed visualization provides insight into land cover change and wetland degradation at Kolleru Lake. It showcases how satellite data (especially long-term Landsat archives) and GIS analysis can track environmental change for conservation and planning. Watch the full 4-decade time-lapse and see Kolleru Lake’s story unfold: from lush wetlands in the 1980s to heavy aquaculture in the 2000s, and the results of restoration efforts. Stay tuned to Data Driven Info for more satellite-driven GIS insights.
═════════════════════════════════════════════════════════
#KolleruLake #Landsat #SatelliteImagery #RemoteSensing #GIS #NDVI #NDWI #MNDWI #NDBI #LandCoverChange #Wetland #EarthEngine #DataVisualization #EnvironmentalMonitoring #India
═════════════════════════════════════════════════════════
Thank you for watching this comprehensive analysis of Sundarbans transformation through satellite data. If you found this video valuable, please:
✓ LIKE this video to support our channel
✓ SUBSCRIBE for more environmental data visualizations
✓ COMMENT your thoughts on Sundarbans conservation
✓ SHARE this with students, educators, and environmental advocates
✓ CHECK OUT our other geospatial analysis videos
Support our mission to make environmental data accessible and actionable through visualization.
Повторяем попытку...
Доступные форматы для скачивания:
Скачать видео
-
Информация по загрузке:


