Скачать
The line graph given below shows the yearly sales figures for a manufacturing company during the las
Автор: cbsemathsbyanurag
Загружено: 2025-03-23
Просмотров: 833
Описание:
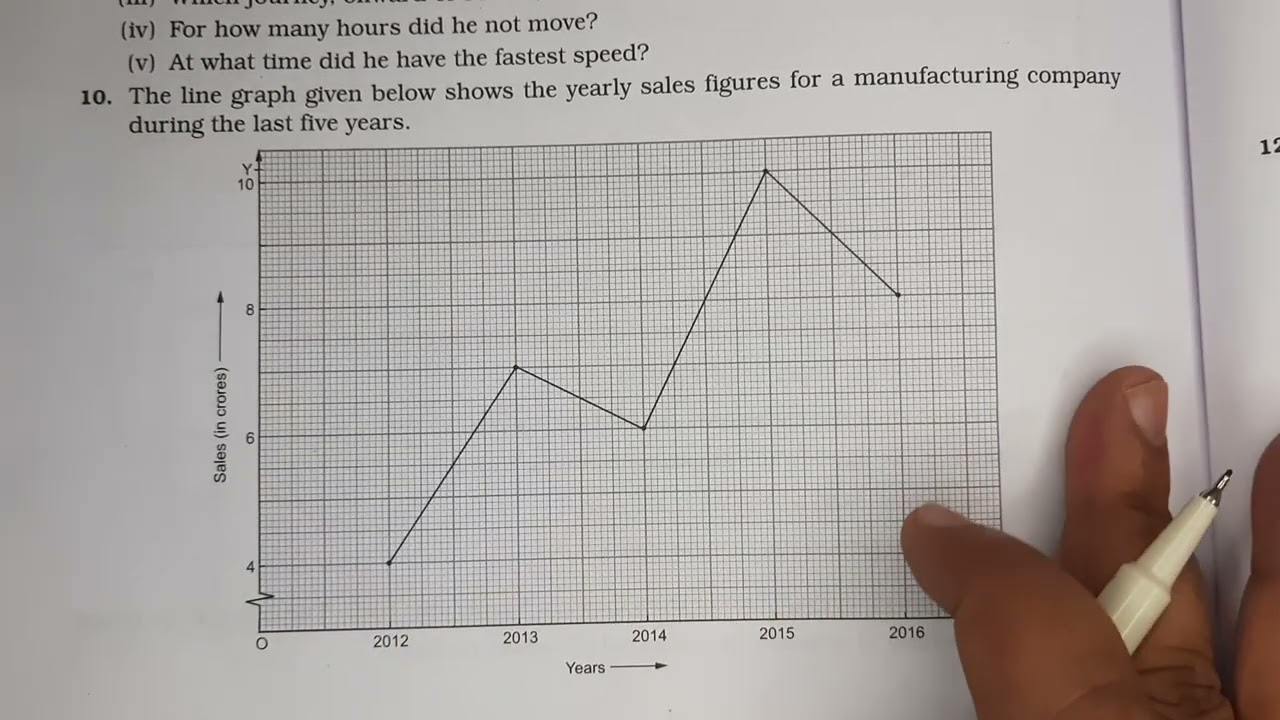
The line graph given below shows the yearly sales figures for a manufacturing company during the last five years.
Study the above graph carefully and answer the questions given below :
(i) What are the sales in
(a) 2013 (b) 2015 (c ) 2016 ?
(ii) Compute the difference between the sales in 2012 and 2016 ?
(iii) In which year was there the greatest difference between the sales as compared to its previous year?
Не удается загрузить Youtube-плеер. Проверьте блокировку Youtube в вашей сети.
Повторяем попытку...
Повторяем попытку...
Доступные форматы для скачивания:
Скачать видео
-
Информация по загрузке:


