Build an Interactive Customer Revenue Dashboard in Power BI (Part 2)
Автор: Daffa Faqih S
Загружено: 2026-02-13
Просмотров: 103
Описание:
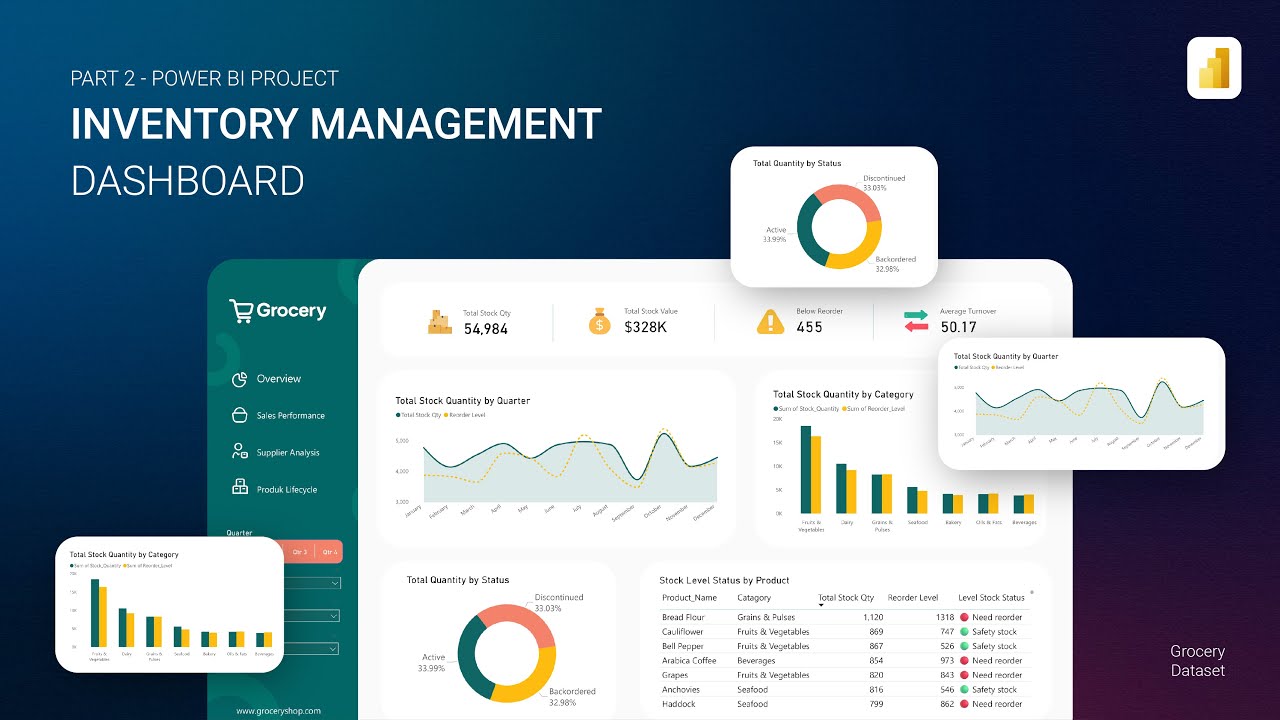
This is Part 2 of the Customer Revenue Dashboard series in Power BI.
In this video, we will build:
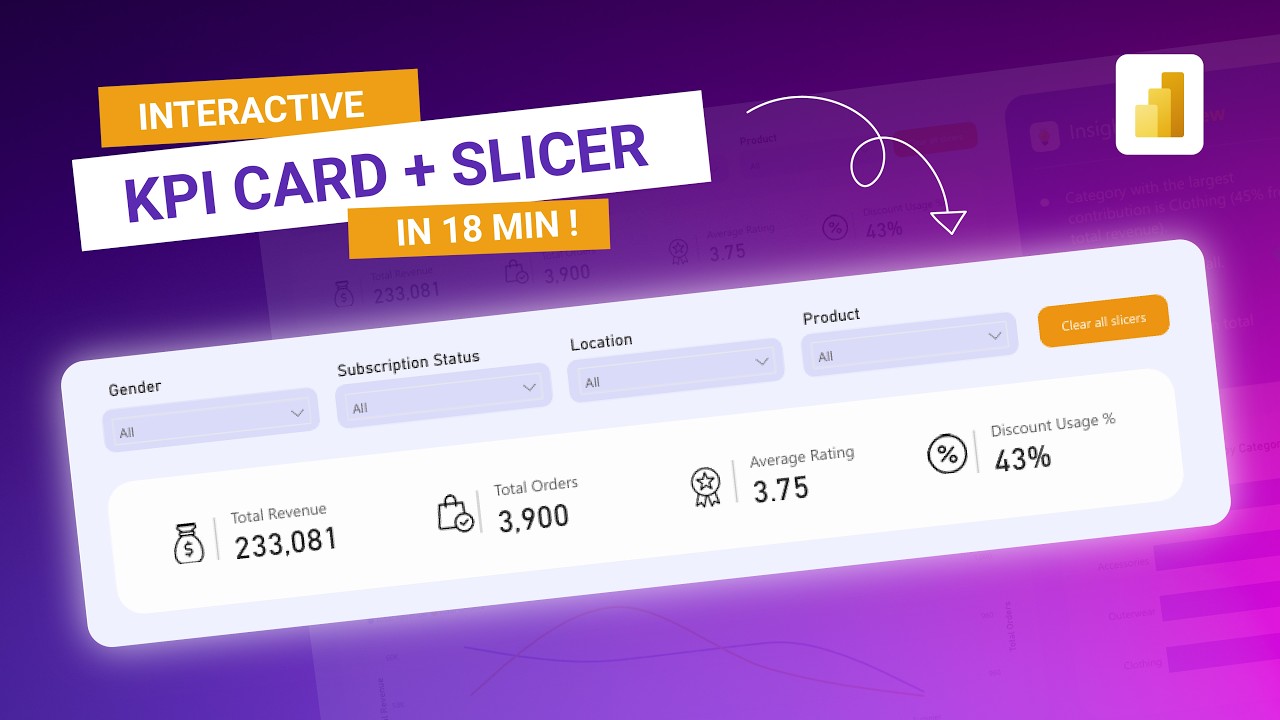
• Interactive KPI Cards (Total Revenue, Total Orders, Average Rating, Discount Usage)
• Dynamic Slicers (Gender, Subscription Status, Location, Product)
• A clean and professional dashboard layout
All KPI metrics will automatically update based on slicer selections, making your dashboard fully interactive and presentation-ready.
This tutorial is perfect for:
• Data Analysts
• Business Intelligence Professionals
• Finance & Sales Analysts
• Power BI Portfolio Projects
If you haven’t watched Part 1 (Data and DAX Preparation), make sure to check it out first to follow the complete dashboard development process.
Subscribe for the next part where we’ll dive into visual analysis and smart storytelling 🚀
Повторяем попытку...
Доступные форматы для скачивания:
Скачать видео
-
Информация по загрузке:


![ARMIA PUTINA DRUGĄ ARMIĄ ŚWIATA? PRAWDZIWA SIŁA ROSJI [WOLSKI I BOJKE]](https://imager.clipsaver.ru/-0hLR4R3gvk/max.jpg)