WealthTrace Tutorial - Monte Carlo
Автор: WealthTrace Financial Planning
Загружено: 2026-02-12
Просмотров: 42
Описание:
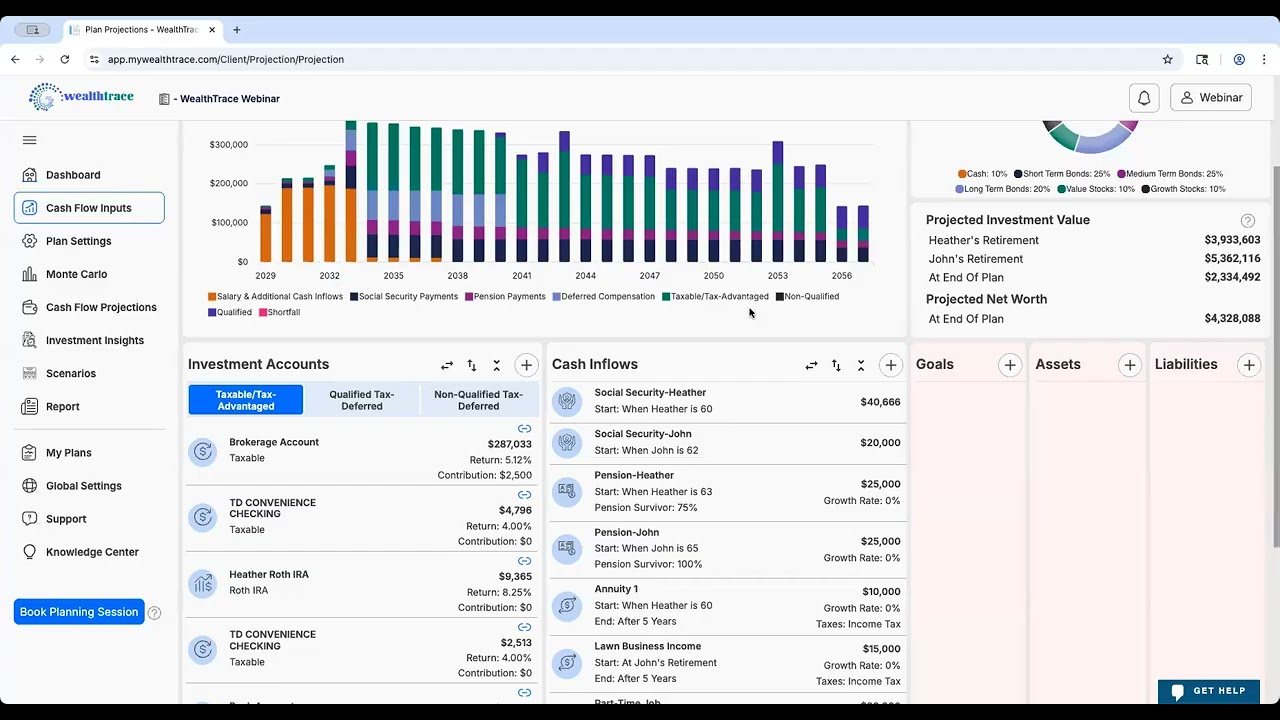
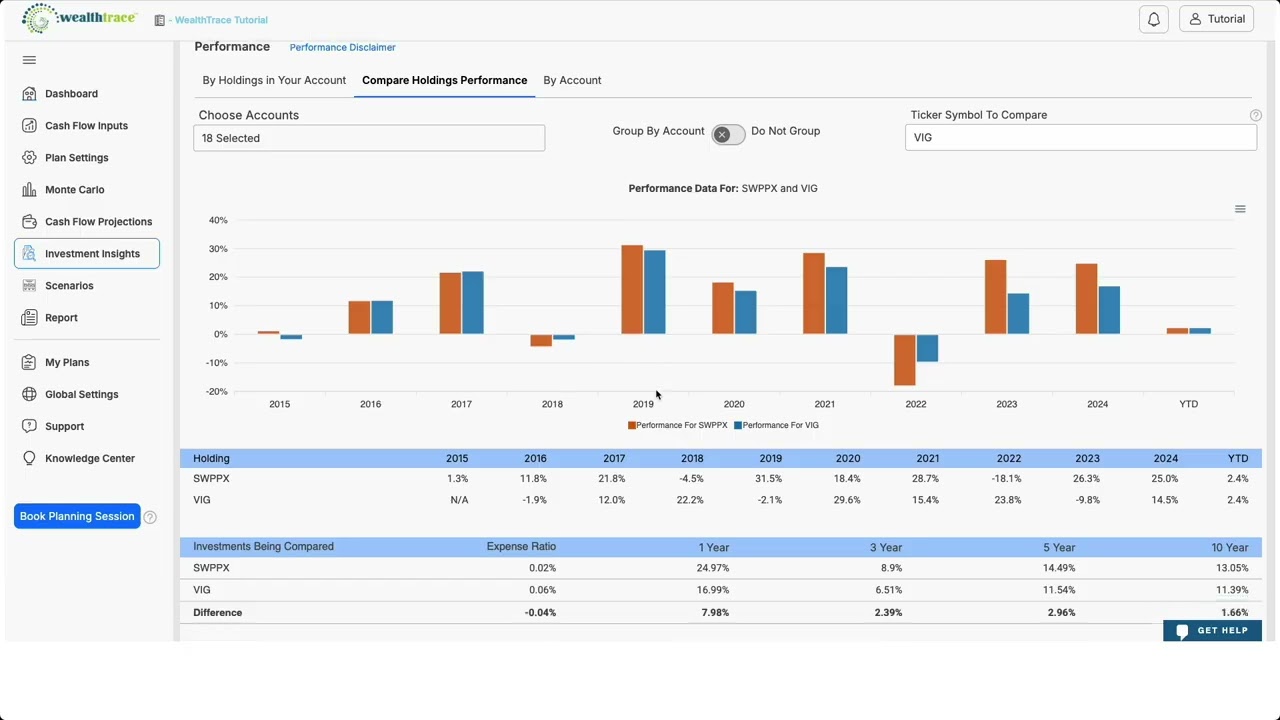
In this tutorial, we walk through the Monte Carlo simulation in WealthTrace and show how to evaluate the likelihood that your retirement plan will succeed. You’ll learn how WealthTrace runs 1,000 scenarios using varying investment returns for each holding, how Dynamic Spending Guardrails adjust retirement spending, and how Quick Scenarios let you test different planning assumptions.
We also explain how to interpret quartile ranges, probability of funding goals, and other detailed results so you can better understand risk, volatility, and the long-term sustainability of your financial plan.
The video is organized into chapters so you can easily jump to the sections most relevant to you.
00:00 – Chapter 1: Monte Carlo
Learn how the Monte Carlo simulation estimates the probability that you will never run out of money in retirement. WealthTrace runs 1,000 simulations with varying investment returns each year, analyzing every holding using historical returns, volatility, and correlations. The result shows the percentage of scenarios in which your portfolio lasts through retirement, with 100% being the best possible outcome.
00:59 – Chapter 2: Dynamic Spending Guardrails
See how Dynamic Spending Guardrails adjust retirement spending based on portfolio performance. If the portfolio rises above an upper threshold, spending increases; if it falls below a lower threshold, spending decreases; and if it stays between thresholds, spending remains unchanged. This feature helps simulations better reflect real retirement behavior and can also be applied to other what-if scenarios.
02:07 – Chapter 3: Quick Scenarios
Use Quick Scenarios to instantly test changes to your plan and observe the impact on your Monte Carlo results. Adjust retirement age, contributions, expected returns, and annual expenses to evaluate how different decisions affect your probability of success.
02:40 – Chapter 4: 1,000 Trials & Quartile Values
Explore the detailed results of all 1,000 simulations. View quartile ranges, median outcomes, and the probability of funding goals over time. The charts show how much variability exists in your projections and help identify portfolio risk and diversification by comparing best-case and worst-case outcomes.
#WealthTrace, #WealthTracetutorial, #financialplanningsoftware, #retirementplanningsoftware, #investmentplanning, #retirementprojections, #dynamicspending, #networthtracking, #MonteCarloanalysis, #Rothconversionplanning, #taxplanning, #investmentaccounts, #portfolioanalysis, #DIYfinancialplanning
Повторяем попытку...

Доступные форматы для скачивания:
Скачать видео
-
Информация по загрузке: