Bayes Theorem Explained with Venn Diagrams and Proof
Автор: studocu
Загружено: 2026-01-09
Просмотров: 349
Описание:
🔑 Bayes Theorem | Conditional Probability | Probability Theory | Set Theory
🔵 The Topic: Bayes theorem explained with visual proof using Venn diagrams.
📐 The Explanation (Step-by-Step):
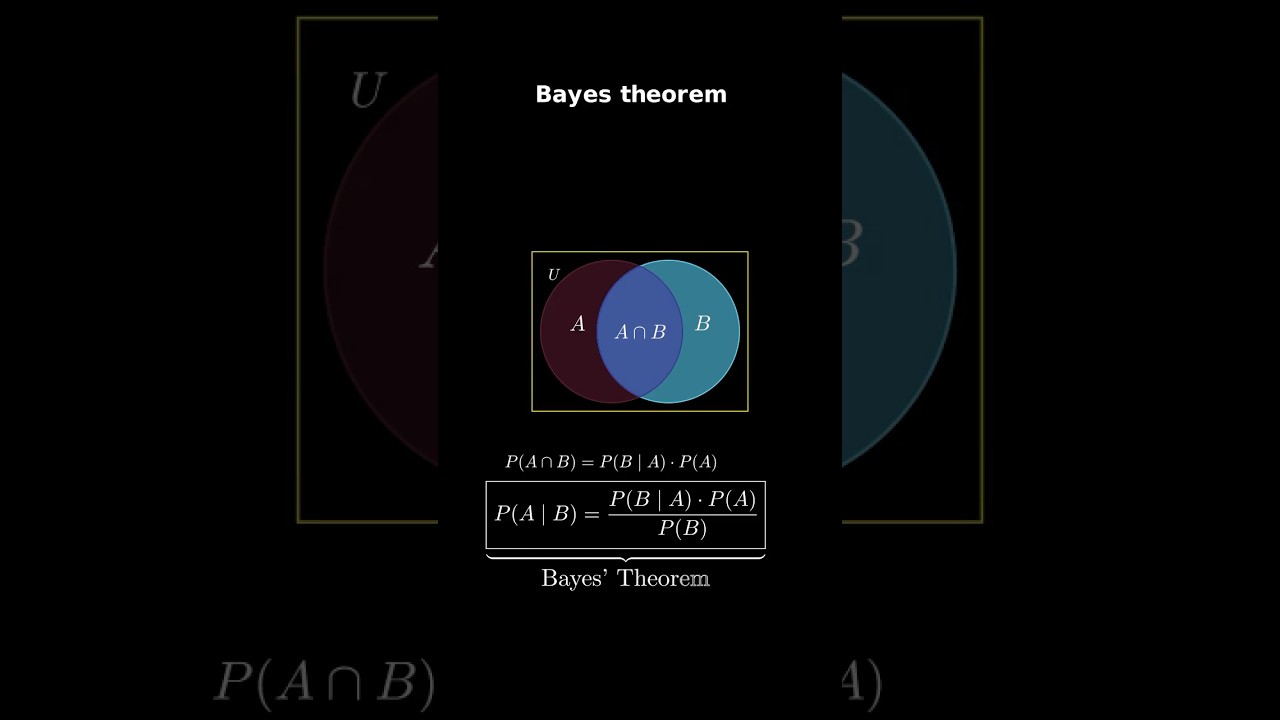
This video explains Bayes theorem using set theory and Venn diagrams. The presentation begins with two non-empty sets A and B within a universal set U, shown as overlapping circles in maroon and cyan colors with their intersection A∩B displayed in blue. The probability of A given B is defined as P(A|B) = |A∩B|/|B|, where the vertical bars represent cardinality (the number of elements in a set). Similarly, the probability of B given A is P(B|A) = |A∩B|/|A|.
The video then multiplies both expressions by 1/|U| divided by 1/|U|, which transforms the cardinality ratios into probability notation. This gives P(B|A) = P(A∩B)/P(A) and P(A|B) = P(A∩B)/P(B). Since both expressions contain P(A∩B), the video shows how to combine these equations. First, it expresses P(A∩B) = P(B|A)·P(A), then substitutes this into the equation for P(A|B). The final result is the Bayes theorem formula: P(A|B) = [P(B|A)·P(A)]/P(B), which is highlighted in a white box at the end.
The visual presentation features a black background with a yellow-bordered rectangle containing the Venn diagram. The formulas are displayed in white and colored text, progressing from cardinality notation to probability notation, clearly showing each algebraic step in the derivation.
👍 LIKE, SUBSCRIBE, and SHARE with classmates!
💬 Did this help you understand Bayes theorem? Let us know in the comments!
#bayestheorem #conditionalprobability #probability #statistics #venndiagrams #probabilitytheory #mathematics #studocu
Повторяем попытку...
Доступные форматы для скачивания:
Скачать видео
-
Информация по загрузке:


