Скачать
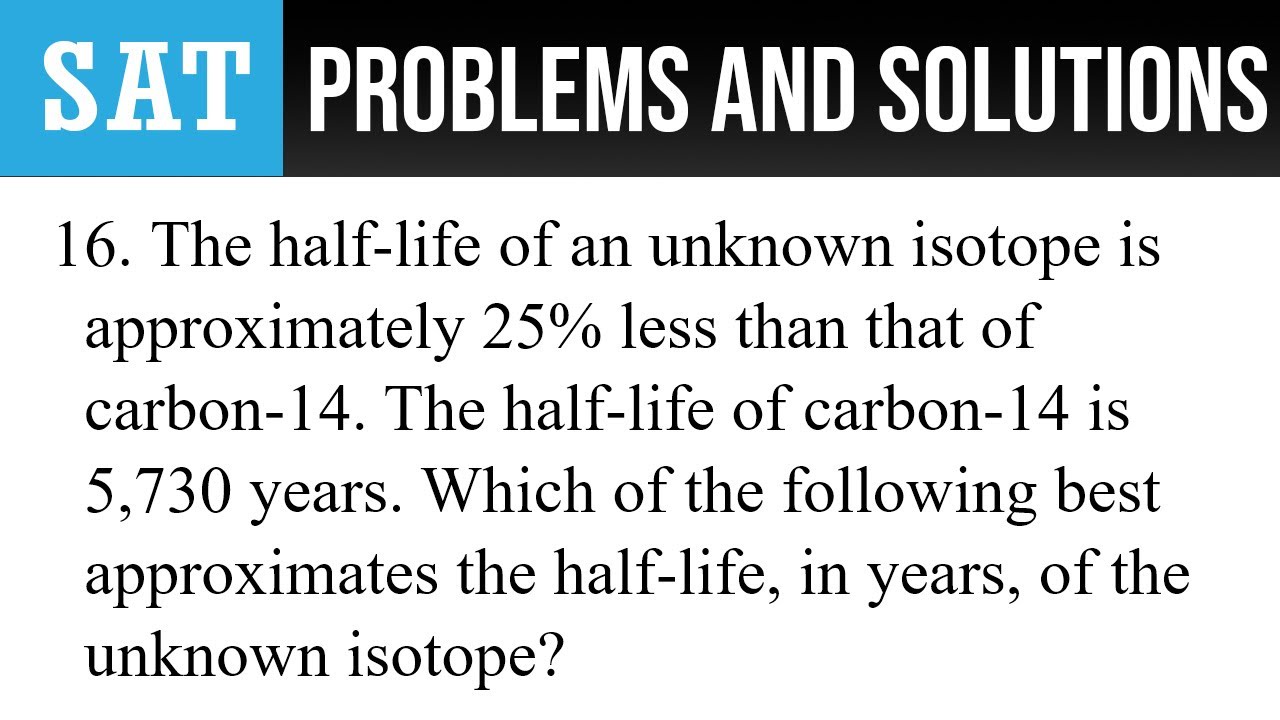
15. According to the line of best fit in the scatterplot above, which of the following best
Автор: The SAT Tutor
Загружено: 2023-11-16
Просмотров: 115
Описание:
15. According to the line of best fit in the scatterplot above, which of the following best approximates the year in which the Population of Town T is projected to reach 5,000?
(a) 2017
(b) 2022
(c) 2028
(d) 2033
2023 10 Practice Tests
Test 2 Calculator
Problem 15
Video 1843 of Hourly Uploads - 11/27/2023 - 1,311 Subscribers - 247,091 Views
Не удается загрузить Youtube-плеер. Проверьте блокировку Youtube в вашей сети.
Повторяем попытку...
Повторяем попытку...

Доступные форматы для скачивания:
Скачать видео
-
Информация по загрузке: