ycliper

Популярное

Музыка Кино и Анимация Автомобили Животные Спорт Путешествия Игры Юмор

Интересные видео

2025 Сериалы Трейлеры Новости Как сделать Видеоуроки Diy своими руками

Топ запросов

смотреть а4 schoolboy runaway турецкий сериал смотреть мультфильмы эдисон
Скачать

Create maps in Stata with spmap

Автор: Eric Lenz

Загружено: 2021-02-03

Просмотров: 21421

Описание: 
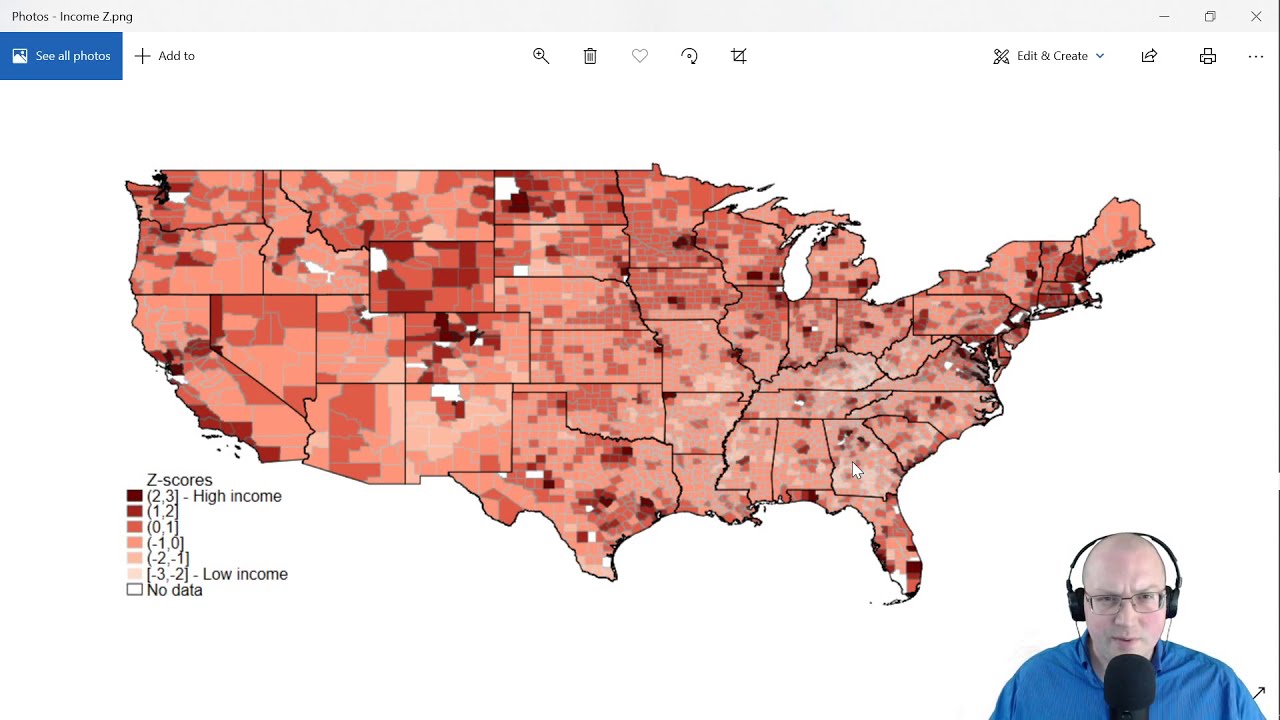
How can you create nice maps in Stata? Kevin Crow and William Gould at StataCorp write a nice walkthrough for the spmap command. I follow their basic outline using income per person and county coordinate data. Then I show how to customize the color palette, change the legend, and display z-scores.

The data is from the IRS Statistics of Income (SOI) and American Community Survey (ACS) Migration Flows from 2014 to 2018. The income measure is adjusted gross income per nonmover (person); however, in my code I name the variable "IncPerHousehold". The measure of nonmovers is a number of people; however, the ACS survey is administered per household and asks questions about the number of people.

The data and program: https://drive.google.com/file/d/1TwJr...

The steps for spmap by Kevin Crow and William Gould at StataCorp: https://www.stata.com/support/faqs/gr...

A list of FIPS codes by county: https://en.wikipedia.org/wiki/List_of...

A list of color schemes for spmap: http://repec.sowi.unibe.ch/stata/pale...

My website: https://sites.google.com/view/lenz

---Contents of this video---
00:00 - Intro
00:10 - Program code and data
00:18 - Shape (.shp) and Database (.dbf) files
01:23 - Data view
02:04 - Merge main variable (.dta) file and counties.dta
02:47 - Sort and identify non-matching data
03:29 - Spmap command
04:14 - Map
04:42 - fcolor(Blues2) option
05:10 - clnumber(6) option
05:43 - State outlines polygon() option
6:37 - Eliminate non-matching from statecoord.dta
07:58 - Map with state outlines
08:16 - Map with grey county outlines
08:40 - Map with clmethod(stdev)
09:15 - Generate z-scores
09:47 - Map with z-scores
09:56 - Change legend clmethod(custom) clbreaks
11:28 - Website sources
12:02 - Color schemes

Не удается загрузить Youtube-плеер. Проверьте блокировку Youtube в вашей сети.
Повторяем попытку...
Create maps in Stata with spmap

Поделиться в:

Доступные форматы для скачивания:

Скачать видео

  • Информация по загрузке:

Скачать аудио

Похожие видео

DIME Continuing Education: Spatial Data Analysis in Stata 2020-10-08

DIME Continuing Education: Spatial Data Analysis in Stata 2020-10-08

How to Estimate Spatial Panel Data Models in Stata

How to Estimate Spatial Panel Data Models in Stata

Python replication of #NLP in Identifying Monetary Policy Shocks: A Natural Language Approach

Python replication of #NLP in Identifying Monetary Policy Shocks: A Natural Language Approach

Data Visualization in Map with STATA

Data Visualization in Map with STATA

European Central Bank Sentiment Index in Python! #nlp

European Central Bank Sentiment Index in Python! #nlp

The very basics of Logit and Probit models in Stata.

The very basics of Logit and Probit models in Stata.

ВОЙНА ИЗ ПОСЛЕДНИХ СИЛ. БЕСЕДА С ИГОРЕМ ЛИПСИЦЕМ @IgorLipsits_1950

ВОЙНА ИЗ ПОСЛЕДНИХ СИЛ. БЕСЕДА С ИГОРЕМ ЛИПСИЦЕМ @IgorLipsits_1950

Как Россия учится летать на старых самолетах

Как Россия учится летать на старых самолетах

How to Make Maps in Stata

How to Make Maps in Stata

Для Чего РЕАЛЬНО Нужен был ГОРБ Boeing 747?

Для Чего РЕАЛЬНО Нужен был ГОРБ Boeing 747?

Учебное пособие по Stata: Вводная очистка данных с использованием панельных данных

Учебное пособие по Stata: Вводная очистка данных с использованием панельных данных

Using local macros in Stata

Using local macros in Stata

Estimate confidence and forecast intervals in Stata

Estimate confidence and forecast intervals in Stata

Stata Basics #6: Importing data into Stata, cleaning data (also, do-files!)

Stata Basics #6: Importing data into Stata, cleaning data (also, do-files!)

Stata Tutorial: Introduction to Stata

Stata Tutorial: Introduction to Stata

Tobit and Heckman models in Stata

Tobit and Heckman models in Stata

Creating Maps in Stata

Creating Maps in Stata

Stata vs R vs Python - What Should I Master to Analyze Data?

Stata vs R vs Python - What Should I Master to Analyze Data?

CAI 2300: Natural Language Processing: An Intuitive Look at How LLMs Work

CAI 2300: Natural Language Processing: An Intuitive Look at How LLMs Work

Выучите R за 39 минут

Выучите R за 39 минут

© 2025 ycliper. Все права защищены.


  • Контакты
  • О нас
  • Политика конфиденциальности


Контакты для правообладателей: [email protected]