How to Draw a Histogram | Junior Cycle Higher Level Maths 2023 Q4
Автор: Maths Made Easy Grinds
Загружено: 2026-02-14
Просмотров: 52
Описание:
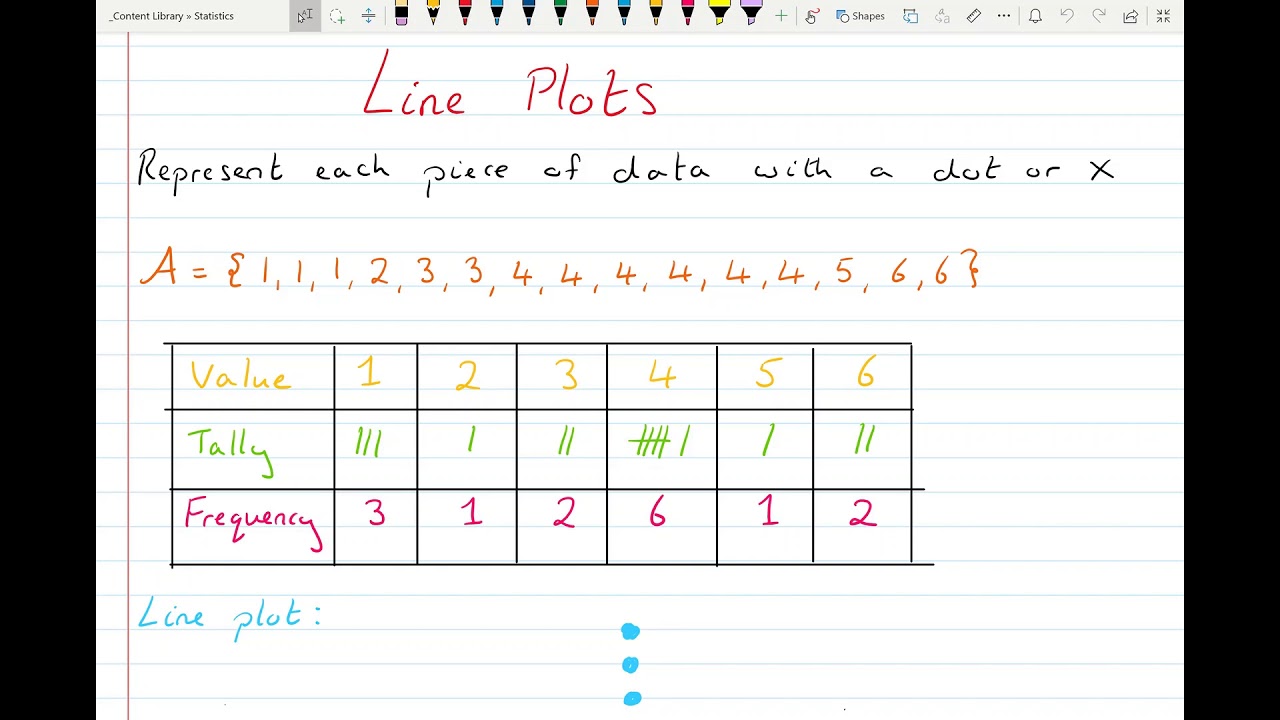
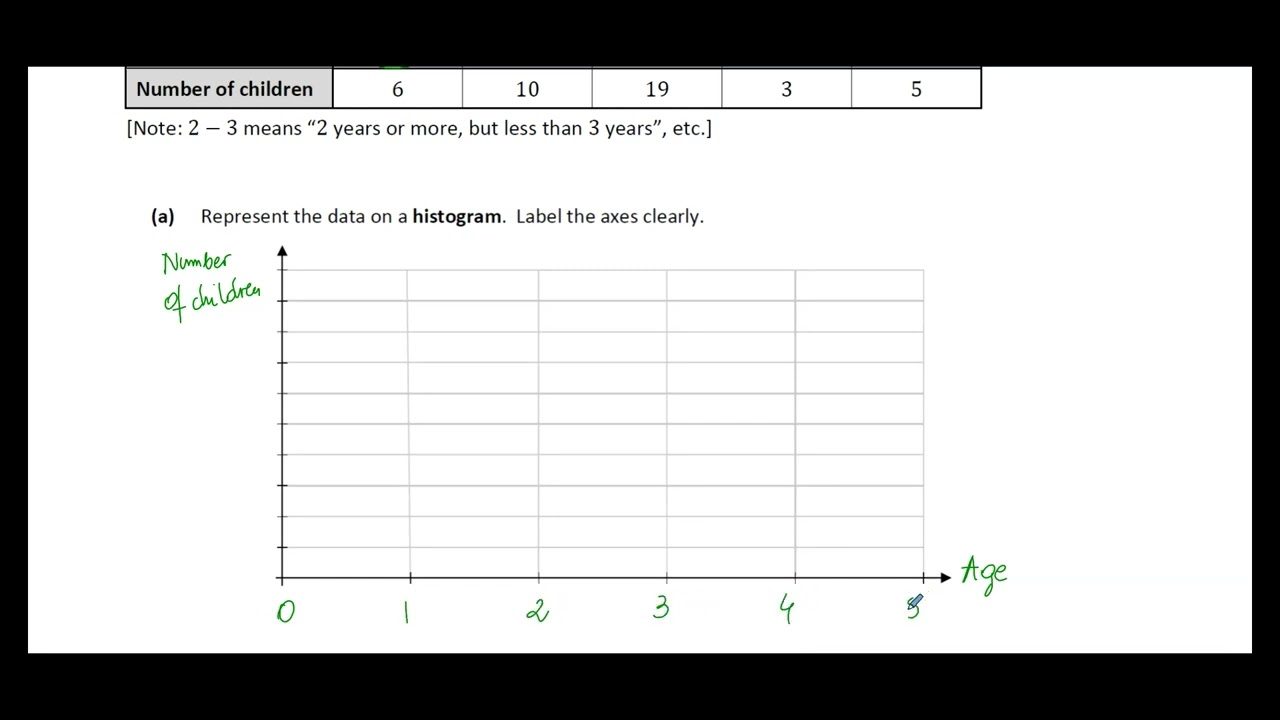
In this video, we walk through how to represent data on a histogram, using Question 4 from the 2023 Junior Cycle Higher Level Maths paper.
We cover:
How to label your axes correctly.
Understanding age intervals (e.g., 2 - 3 means 2 years or more but less than 3).
Choosing an appropriate scale for the vertical axis (Number of Children).
Drawing the bars accurately for each category.
This is a common exam topic, so make sure to practice your labeling and scaling!
00:00 Introduction to Question 4
00:15 Understanding the data table and intervals
00:54 Labeling the horizontal and vertical axes
01:38 Choosing the right scale for the vertical axis
02:12 Drawing the histogram bars
02:45 Completed histogram overview
Junior Cycle Maths, JC Maths, Junior Cert Maths, Histograms, Statistics, Junior Cycle 2023 Maths Paper, Higher Level Maths Ireland, Project Maths, How to draw a histogram, Maths School of Grinds, JC Maths Solutions, State Exams Ireland
Повторяем попытку...
Доступные форматы для скачивания:
Скачать видео
-
Информация по загрузке:


![[4K FULL HD] Relaxing Water Background | 1 HOUR | Calm Water Wallpaper (No Sound)](https://imager.clipsaver.ru/y9PTNTSpGJs/max.jpg)